Binary Options Charts – Free Charting
Binary options charts have not always been of high quality when delivered direct from brokers. However, that has changed over the years as CFD providers have entered the market and binary platforms have integrated charting packages like TradingView.
This guide for beginners explains where to find charts for binary options trading and shares our practical tips for getting the most out of your charting software.
Brokers With The Best Binary Charts
We’ve used every major charting platform in the market, from both brokers themselves and third-party providers, and these stand out as the best for binary traders:
| Broker | Min Deposit | Expiry Times | ||
|---|---|---|---|---|
|
|
Pocket Option | $5 | 3 seconds - 1 month | |
 |
Deriv | $5 | 15 seconds - 365 days | |
|
|
Quotex | $10 | 5 seconds - 4 hours |
Live Market Chart
This is an underlying price chart from TradingView. A growing number of binary brokers now offer TradingView-style charts, but payouts and analysis tools may still differ between providers.
Why Expiry Precision Demands Better Charting Tools
Binary options require a higher level of candle accuracy than many other trading products. This is because you are not only forecasting direction, but you’re also forecasting direction within a fixed, often unforgiving time window.
To trade with any consistency, you need charts that show:
- Precise candle opens and closes
- Real-time tick movement with no freezing
- Fast refresh rates
- Clean wicks
- Accurate historical structure
- Real-market prices
When I’ve used high-quality charting tools for trading binaries, my setups have been clearer and wins more predictable. When I’ve used weak charts, I’ve got false signals, laggy candles, or delayed closes and the results showed it.
Why Broker Charts Don’t Always Match Up
If you have used any of binary options broker platforms, or you are just a beginner who has looked around one or two of the platforms, one thing will stand out: the availability and quality of interactive charts is much lower than those provided in other markets, such as by CFD brokers.
Binary brokers have upped their game in this department going beyond candlestick charts, but lots still rely on basic, web-accessible charting platforms available on desktop or mobile devices.
From our hundreds of hours spent using binary brokers’ charts, we’ve seen the same issues crop up:
- Limited indicators (sometimes just moving averages and RSI)
- Restricted timeframes (very few offer real tick charts, with shallow price history)
- OTC price feeds that don’t perfectly match execution
- Candles closing 1–3 seconds behind real-market timing
- Freezing during volatility
- Candles “jumping” as brokers refresh OTC prices
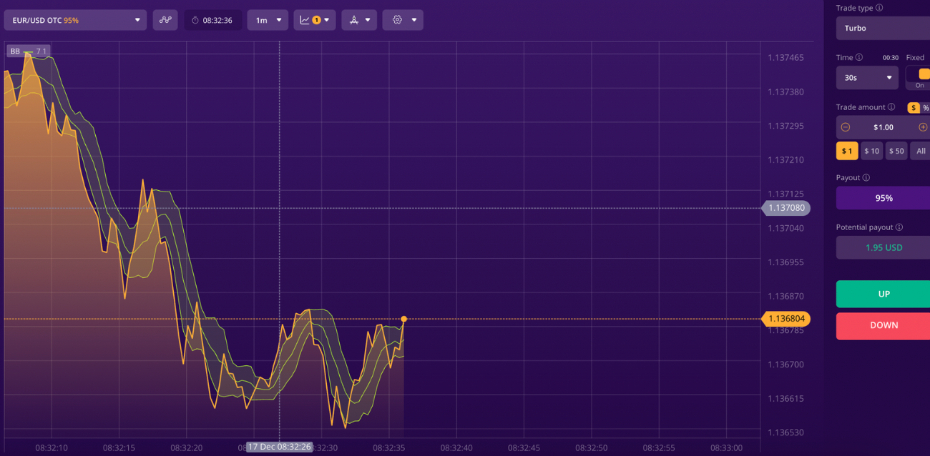
Forex binary chart with bollinger bands
OTC Feeds Explained
Part of the problem is that most binary brokers use OTC (Over-The-Counter) pricing. These feeds are designed to mirror real-market conditions but are still proprietary. This leads to small but important differences, such as 1–2 tick variance vs TradingView, candle closes based on broker server time, and occasional pauses while the broker recalculates prices.
None of this is necessarily “rigged”; OTC feeds are standard for binaries, especially at offshore firms, but it means you can’t always rely on broker charts for structural analysis.
Where To Get More Charting
Charts are ultimately the mainstay of technical analysis in the binary options market. Without charts, there would be no analysis of assets for trading opportunities, and without analysis, traders may be essentially gambling.
Binary options also move fast. Expiries are tight, with many brokers now offering contracts that last just a few seconds. A single tick at the wrong moment can flip a clean winning trade into a loss.
As such, it is important for traders to know where to access charting tools for trade analysis, as these will provide the trader with information for an informed trade decision when trading binary options assets.
Below we reveal some places where traders can get excellent charting tools to analyze the markets and make informed binary trades.
Chart Sources
Chart sources are of two types:
- Online charts are web-based charts available from the websites of certain brokers and software vendors. Although they’ve come a long way, these charts from binary brokers especially, typically do not provide as much flexibility in terms of interactivity and the tools that can be used with them when compared with downloadable charting software. That’s why for serious technical analysis, we recommend using a downloadable charting terminal as described below.
- Downloadable charts as the name implies, can be downloaded either as part of forex trading platforms or as software standalone plug-ins. They are the best for the purposes of analysis of assets for binary options trading since they generally offer more charting types, technical indicators, drawing tools, and other features to support detailed analysis. They are our preferred option for advanced traders.
Some charting sources will provide free access to the charting tools. There are some which are free but will require some paid plug-ins to work, and there will be those that come in a complete package that has to be paid for 100%. Some of these charting sources for downloadable forex charts that can be used for binary options analysis are as follows.
| Chart Source | Best For | Accuracy (out of 5) | Tools (out of 5) | Stability (out of 5) | Matches Broker Feed? | Notes |
|---|---|---|---|---|---|---|
| TradingView | Forex, crypto, indices, gold | 5/5 | 5/5 | 5/5 | No | Best analysis platform overall |
| MT4 | Forex binaries | 4/5 | 5/5 | 4/5 | Sometimes | Great backup but timing varies |
| MultiCharts | Forex charting with multi-timeframe analysis | 4/5 | 4/5 | 4/5 | No | Downloadable and web-based, plus includes ODM chart trading feature for precise tagged execution levels and reminders |
| Generic Offshore Charts | Beginners testing | 2/5 | 1/5 | 2/5 | Only their feed | Sometimes inaccurate analysis |
TradingView Charts
TradingView has emerged as one of the best charting platforms for active traders, featuring a more extensive set of indicators and drawing tools than MetaTrader, along with a more modern and intuitive interface that we prefer.
We’ve spent countless hours using it and appreciate that you get faster candle rendering, cleaner drawing tools, better zoom depth, and multiple timeframes that align with the short-term nature of binaries.
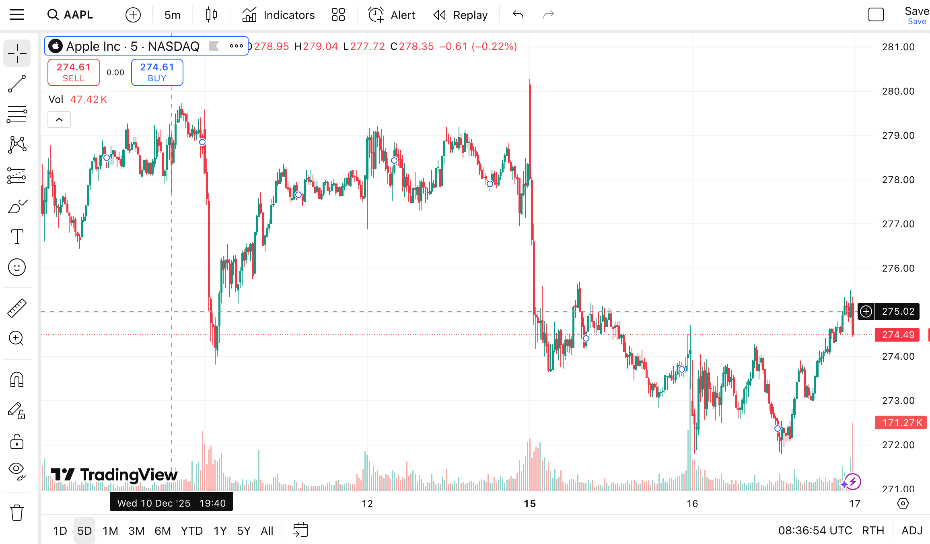
TradingView superchart
For the binary trader, it’s also an attractive option because as well as being accessible directly on its website with options like Supercharts that allow you to analyze thousands of instruments with an extensive list of technical indicators, with new options regularly added and existing tools frequently improved, TradingView-style charts have also been added by some binary brokers.
Binary firms don’t offer the full set of indicators and drawing tools you get in the standalone terminal, but it’s still a step up from binary charts of the past and the ability to analyze and place binary trades from a familiar chart makes for a more complete trading experience.
MT4 Charts
One of the best sources for free charting information and interactive charts is the MetaTrader 4 (MT4) platform. MetaTrader won’t win any design awards, but it remains one of the most stable charting tools available.
This platform is available from many market maker brokers in the forex market. Also, a number of binary options brokers offer MT4, either because they also offer forex and CFD trading services, meaning you can use it to analyze markets but you’ll still need to place binary trades on a binary-specific platform. Alternatively, the odd broker actually supports binary trading directly on MT4 charts, often via a plug-in.
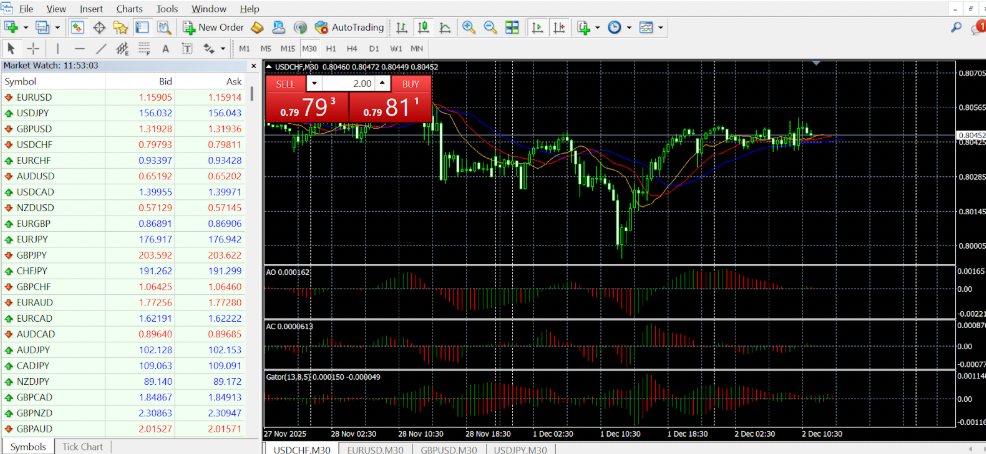
MetaTrader 4 chart
MetaQuotes technically stopped selling new MT4 licenses in 2018, so MT4 is effectively legacy even though it’s still widely offered. Still, virtually everything that most binary traders will need for charting can be found on the MT4 platform. The best part is that it is all free and can be obtained when you download the MT4 platform and create a demo account.
Another beautiful factor that works in the MT4’s favor is that the MQL programming language on which the platform was built supports the building of expert advisors (EAs), indicators and software plug-ins that aid in signal generation. These signals can then be exported to the MT4 platforms.
Check out our MT4 guide in the forum.
MultiCharts
Multicharts is a downloadable chart software that provides high-definition forex charts on 30 different currency pairs. The charts also have a web-based version. Traders can utilize several time frames that span from one minute up to one month.
The MultiChart charting and trading platform is a robust package that even has a useful ODM chart trading feature that zeroes down on the exact price that a trader wants to execute his trade on, tags it and uses this information to remind the trader about the trade if there is a lag in time between signal generation and trade execution.
Ultimately, there are many other sources of charting information for use in generating binary options signals. It is up to the trader to decide on which one to use based on cost, ease of use and other parameters tailored to taste.
How To Use Charts Correctly In Binary Trading
Some new traders lose not because their binary strategy is bad, but because their chart and their broker don’t match. Below is the workflow we’ve used to trade binaries.
1. Align Prices Before Taking Any Setup
Open a reliable charting provider like TradingView and your broker chart. Compare:
- Candle shape
- Wick length
- Current price
- Tick speed
If the candles don’t look broadly similar, skip the trade.
2. Verify Tick Behaviour
Tick accuracy matters more than price accuracy.
Check:
- Does the tick flow smoothly?
- Does it match direction and speed?
- Does the broker chart freeze on spikes?
If the broker hesitates or jumps, avoid short expiries.
3. Use the Right Timeframes
Our rule: Analyze on a higher timeframe than you trade.
For example:
- 5-minute chart = structure
- 1-minute chart = entry confirmation
- Tick or 10-second = ultra-short expiries
Trading 60-second binaries using only a 1-minute chart is a common mistake beginners make.
Good chart patterns mean nothing if the market is irrational.
FAQ
What’s The Best Chart Source For 1-Minute Binaries?
In our experience, we’ve found TradingView best for trading binaries on general market assets and Deriv for trading synthetics.
Do I Need Tick Charts To Trade Binaries?
It depends on the length of contracts, but they can be helpful, especially for 30–120 second expiries. Capitalcore, AZAforex and CloseOption offer tick charts for binaries.
Why Does My Binary Options Chart Freeze During Volatility?
OTC engines, which many offshore binary firms use, may be recalculating price. Avoid trading during freezes to prevent unexpected losses.