Binary Options Indicators
Binary options indicators can help traders identify potential opportunities. Some of the best indicators are available for free on brokers’ web-based platforms, as well as third-party platforms like MT4 and TradingView. This beginner’s guide explains how indicators can be used by binary traders, the different types, and shows you how they work on charts.
What Are Binary Options Indicators?
An indicator analyses market movements on trading charts to reveal potential opportunities. Traders can find trends and patterns in underlying markets to inform trading decisions.
Essentially, technical indicators are mathematical formulas that are applied to the price fluctuations of assets, including forex, stocks commodities, and crypto. An indicator aims to assist traders in using objective data that indicates a potential high/low opportunity. Put another way, an indicator takes data from complex graphs and simplifies it into an easily digestible format for traders.
Binary indicators can be downloaded for free on software like MetaTrader 4 (MT4) and other third-party platforms, though after your analysis, you may need to execute trades on your broker’s software, as not all third-party platforms support direct binary trading.
Alternatively, we’ve seen many binary brokers add dozens of technical indicators to their web platforms in recent years, providing sufficient tools for most aspiring traders.
Choice of indicator depends on various factors, including timeframe, instrument, and crucially, your trading strategy.
A technical indicator essentially makes a prediction based on various factors and then sends alerts based on the data. There are also sentiment indicators that look at what people collectively feel the market will do.
Why Indicators Are Important
The overwhelming amount of data available when trading can be confusing. One simple solution would be to ignore the data. However, trading binary options requires a good grasp of the markets so that you don’t end up trading blind.
Technical indicators can be key for some traders to ensuring that binary options trading is based on skill, rather than luck.
Binary options indicators can also be fast and reliable. They can help you to make sense of vast chart data that would otherwise be unmanageable. Not only can they help confirm a hunch, but they can also uncover new leads that may have otherwise gone unnoticed.
Why Indicators Aren’t Perfect
Technical indicators are not a magic bullet. Keep in mind that indicators often fail during high-impact economic news events. When a major central bank speaks, the ‘math’ of an RSI or MACD is usually overriden by fundamental market volatility.
Also bear in mind that binary options are all about the expiry time. An indicator might show a “Buy” signal, but is that for a 60-second trade or a 1-hour trade? That’s why the most important setting for any binary indicator is the ‘Period.’ A shorter period (e.g., 5) makes the indicator more sensitive for 60-second trades but increases the risk of ‘false signals.’ In our own trading and tests, we’ve found that standard settings (e.g., 14) are generally more reliable for 5-minute to 15-minute expiries.
Types Of Indicators
There are many different types of indicators available for binary options, each with specialist qualities. Typically, indicators fall into two types:
- Leading indicators – those that try to investigate the future
- Lagging indicators – those that try to draw from the past to make predictions
In addition, technical indicators then fall into one of five categories based on what they are trying to discern:
- Trend – These indicators show the general market direction (e.g., Moving Averages)
- Oscillators – These move back and forth within a set range to show momentum or “overbought/oversold” conditions (e.g., RSI)
- Momentum – These are designed to show the strength of a trend and then signal where a reversal is likely to happen.
- Volatility – Volatility indicators show periods of high or low volatility in a market. They show the extent of market movements and how much prices are changing.
- Volume – Volume indicators show the number of units of an asset being bought and sold. While trading volume should not alone influence the value of your options, it can paint a helpful picture of market activity.
Repaint Or Non-Repaint
Binary options indicators can be repainting or non-repainting. A repaint indicator keeps changing its values. They always use future data to determine values and entry signals. In doing this, they try and make historical entry and exit signals look more accurate.
A non-repaint (or no repaint) indicator does not change its values after the price bar or arrow has closed. They use price bars to the left (not in the future) when calculating values. Both repaint and non-repaint indicators can be used on MetaTrader and binary firms’ own platforms.
Picking which to use is up to you. From our hundreds of hours configuring binary charts, repaint options tend to look nicer, particularly when viewed historically. However, they can be unappealing for real-time trading because alerts can disappear after they are shown. Moreover, you could end up placing a trade based on a buy signal that has disappeared.
Scammers have also sought to utilise this opportunity. Unfortunately, there are many unreliable binary indicators of both kinds online. Before you use any, check forums or reviews to see whether they can be trusted, and keep in mind reviews can’t always be trusted as they can be manipulated in some cases.
The Best Binary Options Indicators
Here, we detail how to use five popular binary trading indicators:
Average True Range (ATR)
Average True Range is a volatility indicator that measures how much a price is changing, or how stable it is. It only requires historic data to calculate and generate trade signals and it can be applied to any timeframe.
The range is calculated by subtracting the low from the high and is represented by the largest of:
- The most recent high minus the most recent low;
- The absolute value of the most recent high minus the previous close;
- Or the absolute value of the most recent low minus the previous close.
ATR can be used in two ways: to determine when to enter or exit a trade, and to determine the size of the trade. A high ATR represents increased volatility and a low ATR means the price is relatively stable.
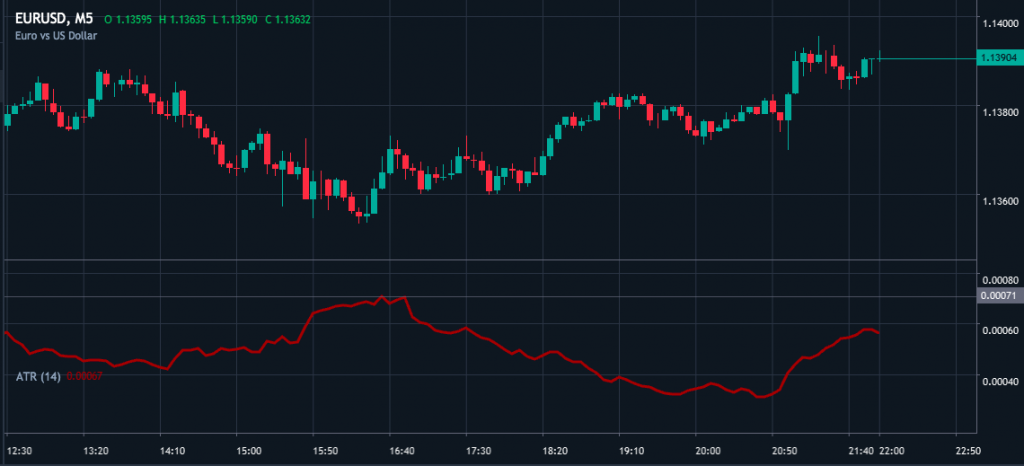
The drawback is that it does not predict the direction of price movement, it only predicts how likely it is to happen. As a result, ATR is one of the binary indicators that is best used when combined with other indicators.
Relative Strength Index (RSI)
The Relative Strength Index is a momentum indicator. It aims to signal whether a market has been overbought or oversold. This helps traders decide whether to buy or sell a binary options contract, as well as determine the right expiry time.
RSI places an asset on a scale of 0 to 100. If the figure is above 70 it is considered overbought, whilst under 30 is considered oversold. The number is calculated by dividing the average gain and average loss.
Avoid entering a trade simply because the RSI hits 70 or 30. In strong trends, these levels can be maintained for a long time. A more reliable signal is waiting for the RSI to cross back below 70 (for a short) or cross back above 30 (for a long), ideally after a “divergence” where price makes a new high but the RSI does not.
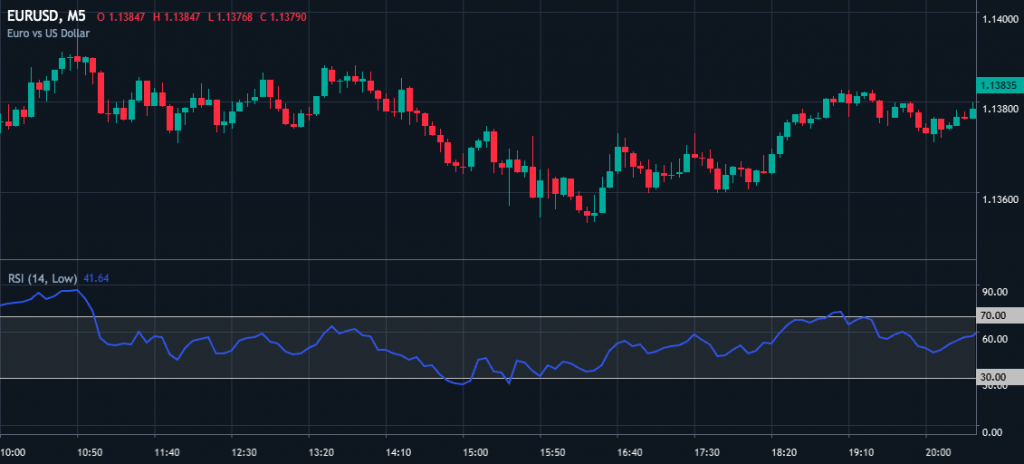
The downsides of RSI binary options indicators are that they are poor at spotting reversals and can lag changes in long-standing trends. It is at its best when prices are oscillating between bearish and bullish.
Stochastic Oscillator
A stochastic oscillator is another type of momentum indicator. It compares the closing price to a range of prices of an asset over a given period.
Like RSI, it is represented on a scale of 0 to 100.
However, unlike RSI, there are two lines displayed by a stochastic oscillator. The first, known as the fast stochastic, is a moving average. The second, the slow stochastic, is calculated as %K through the formula:
%K= ((Closing price – lowest price in chosen period) / (Highest price in chosen period – lowest price in chosen period)) x 100
The stochastic indicator also shows whether an asset is overbought or oversold. In this case, a figure of 80 or above means it is overbought. This means you could enter a short (low) position with your binary contract.
A figure under 20 means it is oversold and you may want to consider going long (high).
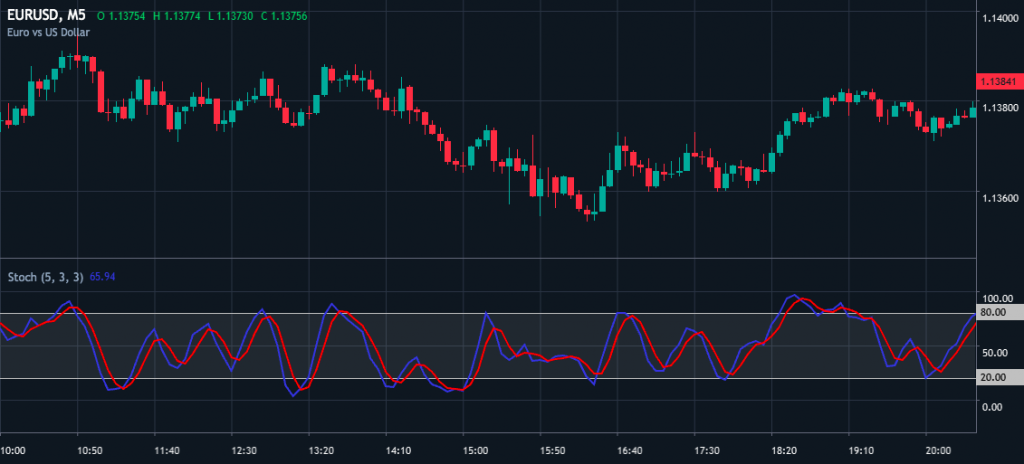
The main weakness is that this indicator can produce false positives, especially during periods of high volatility. Like most binary options indicators, it is best used in conjunction with signals.
Moving Average Convergence/Divergence (MACD)
The MACD binary options indicator is a popular option. It is a trend indicator that is most accurate during times of high volatility.
MACD compares two moving averages (which are themselves indicators) for two periods. The main tool and point of comparison is the difference between the long-period average and the shorter period average.
Using and reading the MACD indicator is straightforward. When the MACD line crosses above the signal line, it is a bullish signal; when it crosses below, it is bearish.
MACD also highlights the strength of the trend and can signal a reversal when the lines switch direction and converge.
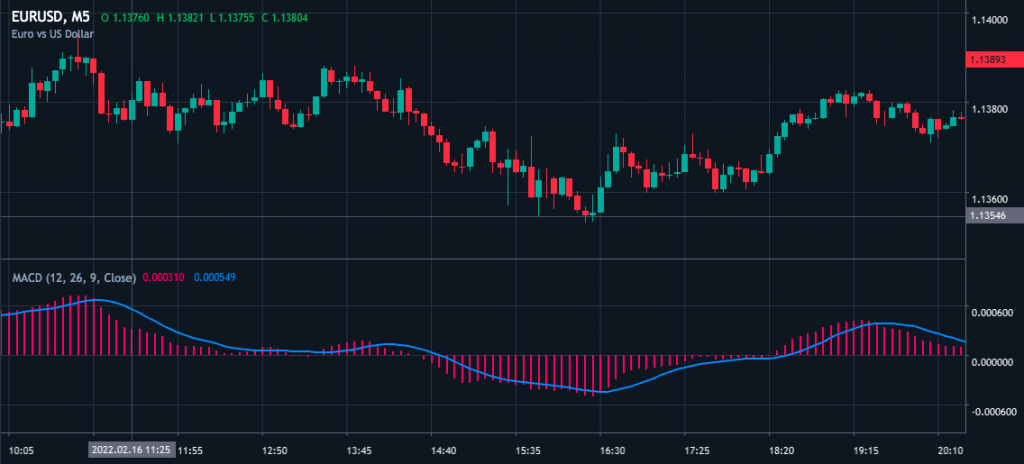
However, this tool can give false indications that a reversal is about to occur. It should therefore not be used to accurately identify reversals. Just like all the binary options indicators we have covered, it is most successful when combined with other tools and signals.
Bollinger Bands (BB)
Bollinger Bands are a multi-purpose volatility indicator. They consist of three lines: a middle Simple Moving Average (SMA) and two outer bands that represent standard deviations. Unlike fixed-scale oscillators, Bollinger Bands expand and contract based on the market’s “breathing” – widening during high volatility and narrowing when the market is quiet.
The bands create a dynamic range for price action:
- The Squeeze: When the bands tighten significantly, it indicates a period of very low volatility. This often precedes a massive price breakout, helping traders prepare for a new trend.
- The Bounce (Mean Reversion): Because the outer bands represent statistical extremes, the price has a tendency to “revert to the mean” (the middle line) after touching an outer band.
- Riding the Bands: In a very strong trend, the price may “walk” along the upper or lower band for several candles.
How to use it in binary trading:
Many traders look for a “rejection” candle (like a pin bar or shooting star) that touches an outer band as a signal for a 5-minute reversal trade.
The caveat: A common mistake is assuming a touch of the upper band is an automatic “sell” signal. If the price closes outside the band, it often indicates a surge in momentum rather than a reversal. Always look for a secondary confirmation. By this we mean things like a candle closing back inside the band, and do this before executing a high/low contract.
Free Indicators
There is a vast library of free binary options indicators available at most online brokers, including Pocket Option, Quotex and IQ Option.
In addition, TradingView and MetaTrader provide all the indicators mentioned above for free.
There are also plenty of bespoke indicators available via free download. However, be extremely wary of “bespoke” indicators found on forums that claim accuracy rates above 90%. We’ve seen a few of these and often they use “repainting” (altering past signals to look successful) or require “Martingale” betting strategies, which can lead to a total loss of your account balance in a single session. Stick to standard tools.
Final Thoughts
Binary options indicators help to manage an otherwise overwhelming amount of data. They simplify charts into an easy-to-understand format which can indicate the right trading move. There are many indicators to choose from and most work best when combined with other tools.
Beginners have a lot to learn when navigating charts and trying different indicators. A binary demo account is a great place to trial various indicators before risking real money.
Also, if you do upgrade to live trading, remember binary options are high-risk financial products where you can lose 100% of your capital. Due to the typical “fixed odds” nature, you often need a win rate significantly higher than 55% just to break even over the long term.
FAQ
What Is The Best Indicator For Binary Options Trading?
There is no simple answer for the best binary options indicators as every trader has their own preference and style. The best strategy is to use a combination of different indicators to inform trading decisions.
Will Binary Options Indicators Increase My Profits?
Binary options indicators do not guarantee increased profits. But what they do provide is the ability to trade with more confidence. Importantly, all indicators should be thoroughly researched before being put into practice.
Are Binary Options Indicators Safe And Reliable?
You should not assume binary indicators are safe, reliable, or that they will guarantee winning trades. Always trade with caution, even with indicators. They are there to inform, but still require due diligence.
Can I Use Binary Options Indicators On MetaTrader 4?
Yes, many indicators are suitable for binary options trading on MetaTrader 4. Most brokers include indicators on their MT4 platform at no extra cost, such as MACD, RSI and Stochastic Oscillator. Others can be bought from the MetaTrader marketplace.
However, not all brokers allow you to actually trade binaries on MT4 – you may need to use MT4 to perform analysis and then execute high/low contracts on your broker’s own software. Alternatively, see our list of the top binary trading brokers with MT4.
Are There Any Free Binary Options Indicators?
Lots of price indicators are available for free on popular platforms such as TradingView, MT4, MT5, and cTrader. A demo account is a good way to find and test different indicators before investing real money.