How to Trade Binary Options 5: Technical Indicators for Binary Options Trading
Technical indicators can be useful in binary trading since they compress price information into a form that can be read quickly. That can help when expiries are short, and the trader needs a cleaner view of momentum, volatility, or trend state. What indicators do not do is predict price with any special authority. They are derived from historic price movements, and sometimes volume, depending on the tool. They are not independent sources of truth about the future, and when traders forget that, using technical indicators tends to get expensive quickly.
Keeping this in mind matters even more in binary options trading, because the fixed expiry structure encourages false precision. A trader sees an RSI crossing 30, a moving average crossover, or price touching a Bollinger Band and assumes the screen is providing an entry. Often it is not. It is only describing a condition. The trader still has to decide whether that condition matters now, on this asset, in this market regime, with this expiry. That part cannot be outsourced to an indicator.
A realistic approach will therefore not treat indicators as an autopilot. Oscillators can help judge stretch and momentum fatigue, volatility tools can help distinguish quiet compression from genuine expansion, moving averages can help with direction and market bias, and so on. When used properly, they can help reduce some of the noise that makes short-term binary trading messy. When used badly, they add a second layer of noise and make the trader feel more informed.
Technical indicators can help binary traders read short-term volatility with more discipline. Oscillators such as RSI and Stochastic can, for instance, help highlight stretched conditions and possible reversals, moving averages can filter direction and keep the trader aligned with the broader bias, and Bollinger Bands and ATR can help us understand whether the market is compressing or expanding or is simply too wild to engage with right now. Indicators can help organize information, but they can not replace judgment.
Here’s where you are in our 10-step guide to trading binary options:
- The Foundations of Binary Options
- Regulatory Landscape and Safety
- Market Analysis I – Fundamental Drivers
- Market Analysis II – Technical Charting
- Technical Indicators for Binary Options Trading
- The Three Pillars of Binary Options Strategy
- Timeframes & Expiry Management
- Money Management & Probability
- The Psychology of Binary Trading
- Advanced Implementation & Tax Compliance
Oscillators and Short-Term Reversals
In technical analysis, oscillators are indicators that move back and forth within a defined range, typically between values like 0 and 100. Their main purpose is to help traders evaluate whether an asset is overbought or oversold, and to understand the strength and direction of price momentum. Instead of following price trends directly, oscillators fluctuate around a central level, which makes them especially useful when markets are moving sideways instead of trending clearly.
One of the key concepts when using oscillators is divergence, which occurs when the price of an asset moves in one direction while the oscillator moves in another. This can signal that the current trend is weakening and a reversal may be approaching.
Oscillators are among the most widely used indicator groups in binary trading because they are built to help answer a question short-term traders ask constantly: has price moved too far, too fast, and is it now vulnerable to a reversal or pause? In binaries, where many traders work with five-minute, fifteen-minute, or similarly short expiries, that question is often highly relevant.
Some of the most commonly used oscillators include the Relative Strength Index, which measures the speed and change of price movements within a 0 to 100 range, and the Stochastic Oscillator, which compares a closing price to its recent price range to highlight momentum shifts. You can read more about that below.
Another widely used tool is the Moving Average Convergence Divergence, which tracks the relationship between moving averages to show changes in momentum, even though it does not have fixed upper and lower limits. The Commodity Channel Index is also popular, helping traders identify deviations from an average price and potential turning points.
Oscillators move inside a bounded range, which makes them visually simple. They can flag so-called overbought and oversold conditions, momentum shifts, and divergence between price and indicator. For a trader staring at short-term volatility, that simplicity is comforting. An overbought condition generally suggests that the price has risen too far too quickly and may be due for a correction, while an oversold condition indicates that the price has fallen sharply and could potentially rebound.
The problem is that markets will sometimes remain overbought or oversold for longer than your binary contract stays alive. This is why oscillators can be useful, but should be paired with context. Oscillators tend to perform best in range-bound markets and are often combined with other tools such as trend indicators or support and resistance levels to improve decision-making.
For binary traders, the implication is clear. Oscillator extremes should be used alongside structure, candles, and level-based context. A stochastic cross above 80 means more when the price is rejecting resistance. An RSI dip below 30 means more when the price is sitting on clear support, and momentum is visibly slowing. Without those conditions, the indicator is often just telling you the market has been moving with energy. That is not an invitation to stand in front of it.
Pro tip: If your binary options platform doesn’t have the indicator you want, as many are web-based and more basic than traditional forex software, you may want to use an advanced third-party charting platform like TradingView.
RSI
The Relative Strength Index (RSI) is one of the most commonly used momentum oscillators. It measures the speed and magnitude of recent price changes and plots the result on a scale from 0 to 100. The classic reference points are 70 for overbought and 30 for oversold, though plenty of traders adjust these depending on the asset and timeframe.
For binary traders, RSI can be used in several different ways. One of the most common methods is to use the RSI to help identify stretched short-term conditions where the immediate move may be losing force. If RSI pushes above 70 and price is simultaneously hitting a resistance zone, the trader may start looking for evidence that upward momentum is tiring. If RSI drops below 30 at support, the trader may begin watching for a bounce setup. That is a sensible use. The foolish use is seeing 70 or 30 and treating the level itself as a guaranteed reversal command.
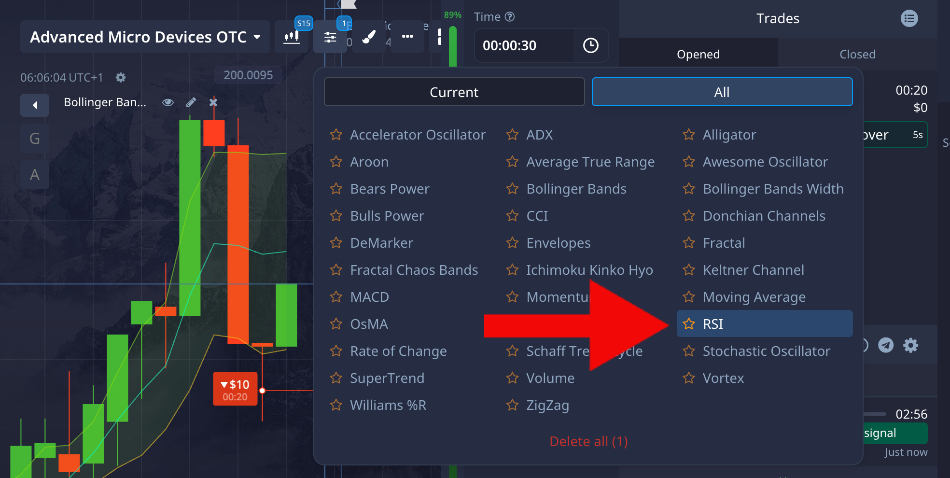
Most binary platforms we’ve tested offer the RSI
RSI is strongest when it agrees with what the price is already suggesting. Suppose EUR/USD is rising into a prior resistance zone on the fifteen-minute chart, RSI is above 70, and the next candle prints a bearish rejection wick. Now, the indicator is not acting alone; it is helping to support the notion that the move has become stretched into a logical ceiling. That can, if other signs also align, support a put setup on a short expiry. By contrast, if RSI is above 70 in a strong uptrend with no visible resistance nearby and candles are still closing firmly higher, using that reading to buy puts is often just a way of stepping in front of momentum.
The RSI works better as a condition filter than as an entry button. It helps you understand if the price has traveled fast enough to be considered stretched relative to its recent history. It does not tell you when the stretch will end. Binary traders need to keep that distinction sharp. In ordinary trading, entering early on a reversal idea can sometimes be managed with wider stops or patience. In binaries, too early tends to end in a 100% loss.
A disciplined binary use of RSI is to combine it with market structure. If the higher timeframe shows a range, RSI extremes near the top and bottom of that range can be useful. If the market is trending strongly, the same extremes can be traps. In an uptrend, RSI readings above 70 can simply show strength. In a downtrend, readings below 30 can simply show weakness. Traders who treat every strong trend reading as a reversal signal usually end up funding the trend rather than trading it.
RSI divergence is another concept sometimes utilized by binary options traders. Bearish divergence appears when the price makes a higher high, but RSI makes a lower high. Bullish divergence is the mirror image. The idea is that price is still moving, but momentum underneath is weakening. In principle, that is useful for binaries because weakening momentum can precede a near-term turn. In practice, divergence is a supporting clue. Markets can print divergence several times before finally reversing, which is not helpful if your expiry is measured in minutes.
The Stochastic Oscillator
The Stochastic Oscillator also measures momentum, but it does so differently. Instead of focusing on the magnitude of recent gains and losses in the way RSI does, the stochastic oscillator compares the closing price to the recent range over a selected period. The core idea is that in strong upward conditions, price tends to close near the high end of the range, while in downward conditions it tends to close near the low end.
Stochastic is often presented with two lines, usually called %K and %D. Traders watch for overbought and oversold zones, commonly above 80 and below 20, and also for crossovers between the two lines. In binary trading, these crossovers are popular because they appear to offer a neat trigger. If the lines cross down from an overbought zone, some traders read that as a put signal. If they cross up from an oversold zone, they read it as a call signal.
As usual, the problem is not that the indicator is useless. The problem is that traders often ask it to do too much. A stochastic crossover in the middle of a noisy chart is close to meaningless. A stochastic crossover near the top of a well-defined range, or after an exhaustion candle at resistance, is more useful because the indicator is confirming a condition the chart already hinted at.
Stochastic oscillators tend to be more sensitive than RSI, which can make them attractive for short-term binary trading. The indicator reacts faster, turns more often, and produces more signals. That sensitivity is both its attraction and its defect. More signals mean more opportunity on paper, but it also means more noise, more false turns, and more temptation to overtrade.
Used well, stochastic oscillators can be helpful in range conditions where price oscillates cleanly between support and resistance. In those environments, overbought and oversold readings, especially with confirming crossovers, can align nicely with reversal setups. Used in a trend without any trend filter, the same indicator can support really bad decisions.
Why Overbought or Oversold Do Not Mean Immediate Reversal
This point needs its own section because it is the most common indicator misunderstanding in short-term trading, including short-term binary options trading. Overbought does not mean price must fall now, and oversold does not mean price must rise now. Both terms mean only that the price is stretched relative to the indicator’s lookback logic. They describe a condition, but they are not a guarantee for any future behavior. In strong trends, overbought can be a sign of healthy bullish pressure, and oversold can be a sign of persistent bearish pressure.
To understand this better, think of indicators like RSI or stochastic oscillators as measuring momentum speed, not predicting turning points. When a market becomes overbought, it simply tells you that buyers have been dominant over a recent period. That dominance can continue much longer than beginners expect. The same applies to oversold conditions, and it is important to understand that strong selling pressure can persist, especially during news events or clear directional trends.
A common mistake inexperienced traders make is treating overbought or oversold signals as automatic “reverse now” buttons. For example, seeing RSI above 70 and immediately placing a put trade, expecting the price to drop right away. In reality, price can stay overbought for multiple candles while continuing to climb. Entering too early in this situation often leads to repeated small losses, which add up quickly in short-term binary options, where each loss is a 100% loss.
It’s also important to recognize the difference between range markets and trending markets. Overbought and oversold signals tend to work better in sideways (ranging) conditions, where the price moves between support and resistance. In those environments, an overbought reading near resistance may indeed increase the probability of a short-term pullback. But in a trending market, those same signals often fail because momentum continues pushing the price in the same direction.
As we talk about a lot in this article, successful traders rarely rely on a single indicator reading. Instead, they look for additional evidence before acting. This might include factors such as the price reaching a known support or resistance level, candlestick patterns showing rejection (like wicks or engulfing candles), and a slowdown in momentum. Without this type of confirmation, an overbought or oversold signal is just a warning that the price is stretched, and should not be viewed as a dependable trigger to trade.
For binary options traders, timing is especially critical because trades expire at a certain point in time, and only that point in time matters for a classic binary option. Entering too early, even if your overall idea is correct, will still result in a 100% loss if the price does not get to where it needs to be at expiry. This makes it even more dangerous to rely solely on overbought/oversold conditions without considering context.
A more practical approach is to think of these signals as filters, not entries. They help you understand the current state of the market. Overbought → buyers are strong, be cautious with selling. Oversold → sellers are strong, be cautious with buying. In summary, overbought and oversold conditions are useful tools, but only when used correctly. They highlight momentum extremes, not guaranteed reversals. Learning to combine them with trend analysis, key price levels, and confirmation signals can significantly improve your decision-making and help you avoid one of the most common beginner mistakes in trading.
Volatility Bands and Expansion Tools
If oscillators try to answer whether the price is stretched, volatility tools try to answer whether the market is quiet, expanding, or on the edge of doing something less polite. In binary trading, this is important because volatility changes the reliability of expiry-based setups. A calm market and a violent market may show the same candle shape, but the odds attached to that shape are not the same.
The two volatility tools most commonly discussed in short-term retail trading are Bollinger Bands and Average True Range (ATR). Bollinger Bands are plotted on the chart and help visualise relative volatility and price location. ATR is usually shown as a separate line and measures average movement size without caring about direction. One gives shape and the other gives scale.
Bollinger Bands
Bollinger Bands consist of a middle line, typically a moving average, plus an upper and lower band set a certain number of standard deviations away from that average. The basic idea is simple. When volatility is low, the bands contract. When volatility increases, the bands expand. Price interacting with the bands can therefore tell you something about stretch, compression, and the current volatility environment.
For binary traders, Bollinger Bands tend to be used in two broad ways:
- The first is mean reversion. If the price reaches or pierces the outer band, some traders look for a reversal back toward the middle band, especially when the move happens at a support or resistance zone, and the candle structure suggests rejection.
- The second is breakout logic. If the bands have tightened into a squeeze and the price then pushes out with force, traders may read that as the start of a volatility expansion.
The danger is confusing “touching the band” with “must reverse.” Price can ride the upper band in a strong uptrend and the lower band in a strong downtrend. In those cases, fading the band touch repeatedly becomes an efficient way of discovering how persistent trends work. The bands are not walls. A touch only says price is moving strongly relative to recent conditions. Whether that strength is about to fail depends on context.
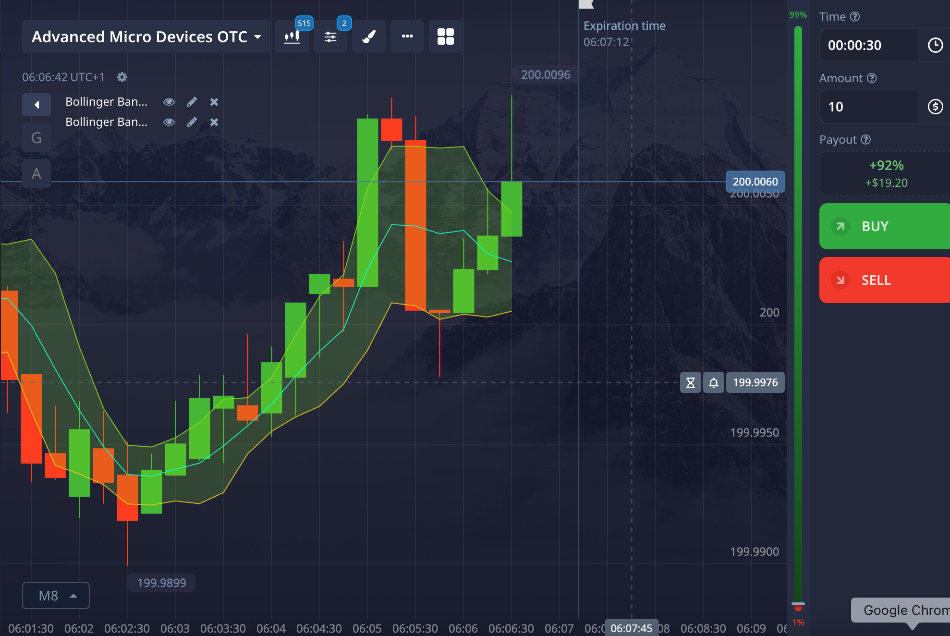
You can usually add BB to charts in one click on most binary platforms
A common binary mistake is using Bollinger Bands without distinguishing between ranging and trending conditions. In a quiet range, band touches can help identify short-term reversal zones. In a strong trend, band touches often confirm momentum rather than exhaustion. This is why the middle band matters too. In many setups, the middle line acts as a kind of balance point. If price repeatedly holds above it and keeps pressing the upper band, the bias remains constructive. If the price keeps failing below it and leaning on the lower band, the opposite is true.
The Bollinger squeeze is often more valuable for binaries than the band touch itself. When bands contract tightly, the market is compressing. Compression tends not to last forever. Eventually, price breaks from the narrow range and volatility expands. For binary traders, this can create useful setups, though only when the breakout is genuine. A false break from a squeeze is common, and in a fixed expiry contract, false breaks are particularly annoying because they consume time while pretending to offer clarity.
A sensible approach is to treat Bollinger Bands as a volatility context tool first and a trade trigger second. If the bands are narrow, be alert for expansion. If the bands are wide and the price is already stretched, be cautious about chasing. If price reaches a band at a major chart level and prints a rejection candle, then the indicator is doing something useful. If not, it may be just another curved line persuading you that geometry equals edge.
ATR
Average True Range (ATR) measures how much an asset has been moving on average over a chosen period, but it does not tell you the direction; it only tells you the size of movement. This makes ATR less visually dramatic than Bollinger Bands and often more useful in practice.
For binary traders, ATR can help answer a very plain question: Is the chosen expiry realistic relative to current market movement? That question is often ignored, and that habit is costly. A trader may expect a five-minute contract to push comfortably in the desired direction without ever checking whether the asset is actually moving enough in that timeframe to make the setup sensible. ATR helps prevent that sort of optimism.
Examples:
- Suppose an asset has a low ATR on the five-minute chart. That means recent candles have been relatively small. If the trader then expects a quick breakout and buys a short expiry binary far from a meaningful level, the contract may simply not have enough movement available to work cleanly.
- Suppose the ATR is elevated. The market may be moving enough to justify breakout logic, though that same volatility can also make reversal entries more dangerous and reduce the reliability of tiny candle patterns.
ATR is also useful for comparing regimes. Rising ATR often tells you that volatility is expanding and that price is covering more ground per candle. Falling ATR suggests contraction and a quieter market. That matters for binary selection because different setups make sense in different regimes. Mean reversion trades may behave better when volatility is contained. Breakouts often need expanding ATR to have any real chance of follow-through.
One trap with ATR is assuming high ATR is automatically good for binaries. It is not. High ATR means larger movement. Sometimes that is helpful. Sometimes it means the market is chaotic, headline-driven, or prone to sudden reversals. A binary trader still needs to ask whether the movement has structure.
Examples of Other Volatility Tools
Bollinger Bands (shape) and ATR (scale) are the core pair when it comes to volatility tools and short-term binary options trading, but there are several other volatility tools that can be useful as well, each with a slightly different lens on market activity.
- Bollinger Bands → Where is price relative to volatility?
- ATR → How much does price typically move?
- Keltner Channels → Is this move strong or just noise?
- Donchian Channels → Is the market breaking out of a range?
- Chaikin Volatility → Is volatility accelerating?
- Historical Volatility (HV) → How volatile has this market been over a defined past period?
For a binary options trader, this matters because expiry-based setups depend heavily on how fast the price can move and not just where it is likely to go eventually. A setup that works in a slow, controlled market can completely fail in a fast, expanding one.
Keltner Channels
These look similar to Bollinger Bands but behave differently. Instead of using standard deviation, they are built around ATR. What they show is a smoother volatility envelope around price, and they can help the trader understand if a move is strong or just noise.
Keltner Channels expand and contract more slowly than Bollinger Bands, and when price pushes outside the Keltner channel, it often signals strong momentum rather than immediate reversal. This makes them useful for spotting when you are dealing with a trend continuation instead of false reversal signals.
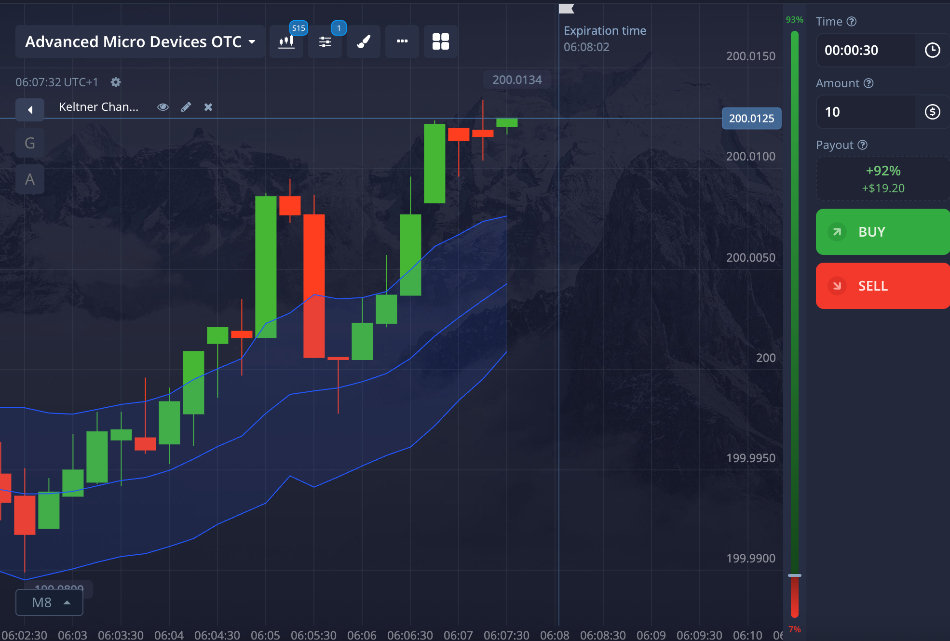
Keltner channels look similar to Bollinger Bands but serve a different purpose
Donchian Channels
Donchian Channels plot the highest high and lowest low over a set period. They thus show the range boundaries of recent price action. We know from history that volatility expansion often begins when price breaks out of a tight range, and this is why Donchian Channels can be helpful. If the channel has been narrow and the price suddenly breaks out, it can signal the start of a volatility expansion phase, which is important for timing breakout-style binary trades. As always, these are just indicators, not surefire predictors of the future.
Chaikin Volatility
This one focuses on how quickly the trading range is expanding or contracting. It shows the rate of change of volatility and can be useful for spotting moments when a quiet market is about to become unstable. Traders typically use the Chaikin indicator when they want to detect a sudden expansion in volatility before it becomes obvious on the chart.
Historical Volatility (HV)
This measures how much the price has moved over time, usually expressed as a percentage. It shows past volatility levels, and the key idea is that markets tend to cycle between low and high volatility. If volatility is extremely low compared to its recent history, traders often expect expansion (and vice versa).
Breakout Logic vs. Mean Reversion Logic
Volatility indicators often force the trader to choose between two incompatible ideas:
- Is the market more likely to snap back toward balance?
- Or is it more likely to expand away from balance?
Bollinger Bands and ATR can support either view, but not at the same moment for the same reason.
Mean Reversion Logic
Mean reversion logic works best when the price is stretched inside a broadly stable environment. The trader is betting that the latest move has overextended and that the price will rotate back toward the center or the middle of the range. In this setting, band touches, RSI extremes, and exhaustion candles can align well.
Mean reversion is built on a simple idea: markets tend to oscillate around a “fair value”. They don’t move in straight lines forever. When price pushes too far, too fast, away from that balance, the probability of a pause or pullback increases. Not because the market must reverse, but because the current move becomes harder to sustain. A useful way to think about it is tension. The further the price stretches from its recent average, the more “tension” builds between the current price and the typical value. Mean reversion trades attempt to capture the release of that tension as the price drifts back toward equilibrium.
However, the environment matters more than the individual signal. Mean reversion trading tends to perform best under these conditions:
- The market is ranging or only weakly trending.
- Volatility is relatively stable (not rapidly expanding).
- Price respects clear support and resistance levels.
- Moves away from the mean happen in short bursts rather than sustained trends.
In this type of market, different tools start to reinforce each other. You might, for instance, see price touching the outer Bollinger Band, an RSI that shows an extreme reading, and candles that show rejection (long wicks, slowing momentum). Individually, none of these should be trusted enough to put money on the line. Together, in the right environment, they suggest that the move may be overextended.
But here’s where many beginners get it wrong. They apply mean reversion logic in trending or expanding markets. In those conditions, “overbought” and “oversold” stop behaving like reversal signals and start behaving like trend confirmation. Price doesn’t snap back; it keeps pushing. What looks like a stretched move is actually strength. For binary options traders, this mistake is especially costly, because reversion setups often require precise timing. Entering too early, before the market actually shows signs of slowing, means your trade can expire while the price is still drifting against you, even if a pullback eventually happens. And a binary option that expires out-of-the-money is a 100% loss even if you got the general idea right.
A more disciplined approach is to separate setup from trigger.
- Setup: Price is stretched (band touch, distance from average, etc.)
- Trigger: Price shows evidence of slowing or rejection (smaller candles, wicks, failure to continue)
Another important detail is the target expectation. Mean reversion does not assume a full reversal of the trend. Often, the move is just a partial rotation back toward the mean, not a complete trend change. For short-term trades, that distinction matters. You’re not predicting a new direction, you’re trading a temporary imbalance.
In summary, mean reversion logic is less about predicting reversals and more about identifying when price has likely moved too far, too fast, within a stable environment. When used correctly, it can be effective, but only when you respect its limitations. It works because the market is calm, not in spite of it.
Breakout Logic
Breakout logic works better when the market has compressed and is showing signs that a new directional move is starting. Here, narrow Bollinger Bands, rising ATR after a quiet period, and a clean break of support or resistance may support a continuation trade.
Breakout trading is built on the idea that markets move in phases of contraction and expansion. Periods of low volatility don’t last forever, and when price becomes tightly compressed, it often means that buyers and sellers are temporarily in balance. A breakout represents the moment that the balance breaks and one side starts to take control.
In contrast to mean reversion (which bets on a return to balance), breakout logic assumes the market is leaving balance and entering a new directional phase. The goal is not to fade the move (trading against the current price move), but to align with it early enough that there is still momentum left during your trade window.
Compression is the key starting point. This can, for instance, be indicated by narrowing Bollinger Bands, small overlapping candles, declining or stable ATR at relatively low levels, and repeated tests of the same support or resistance level. These conditions suggest that volatility has been “stored”, and many traders bank on the idea that the longer and tighter the compression, the more meaningful the eventual breakout can be. Within this context, it is important to understand that you might just as well be facing increasingly more deceptive false breaks.
The actual breakout is not just a level being touched; it’s a shift in behavior. Strong breakouts tend to show a decisive close beyond support or resistance, larger candle bodies compared to recent candles, increasing volatility (ATR beginning to rise), and follow-through (the next candle continues in the same direction). The follow-through is critical, especially in short-term binary trading. If a level breaks briefly and then snaps back, it is just a false breakout.
A practical way to think about breakout logic is pressure release. During compression, orders build up on both sides of the market. When one side finally overwhelms the other, price can move quickly as those orders are triggered. That’s why breakouts often lead to sharp, fast moves, exactly the kind of movement many short-term binary traders look for.
However, context again matters, as always. Not every breakout is worth trading. Weak breakouts often occur in the middle of a range (no clear level), without volatility expansion, after a move has already extended too far, and during low-participation periods (e.g., quiet market hours). For binary options, timing is essential. Entering after the initial breakout candle without confirmation can expose you to pullbacks, while entering too early (before the break is clear) puts you back into mean reversion conditions.
A more structured approach is to look for both the setup, trigger, and context.
- Setup: Compression and a clearly defined level
- Trigger: Strong break with expansion and follow-through
- Context check: Enough room for price to continue moving before hitting the next obstacle
Breakout trades are not about predicting direction in advance; they are about reacting to evidence of imbalance. The market shows its hand first, and the trader responds. In summary, breakout logic works because markets can usually not stay quiet forever. When volatility expands, and price escapes a defined range, momentum often carries it further than expected. But that edge only exists when compression, expansion, and confirmation align.
Do not mix
A common beginner mistake is mixing up mean reversion and breakouts. Traders see a band touch and assume a reversal while ATR is rising and price is breaking structure, or they expect breakout continuation while oscillators and candle rejections are warning that the move is already tired.
For an inexperienced trader, this usually happens because every indicator is treated as a separate “signal” instead of part of a bigger story. One tool says overbought, another shows volatility expanding, and the price is pushing through a level, so the trader ends up with conflicting ideas. This is a situation where many inexperienced traders, eager to be active, take a trade anyway, despite the conflict.
Think of it this way: Is the market staying balanced or is it leaving balance?
- Mean reversion trades assume the market is staying balanced.
- Breakout trades assume the market is leaving balance.
Don’t try to trade both ideas at the same time on the same setup and expect a profit.
Examples of what costly mixing can look like in practice:
- Price touches the upper Bollinger Band, and the trader thinks “reversal”.
- But ATR is increasing, and candles are getting stronger, because the market is actually expanding.
- Result: the trader sells into strength, and the price keeps going against him or her.
- Price breaks above resistance, and the trader thinks “breakout”.
- But the move is slow, candles show long wicks, and momentum is fading, because the move is losing energy.
- Result: the trader buys into exhaustion and price stalls or pulls back.
The problem isn’t the indicators, it’s the interpretation. Indicators are tools, but they only make sense when they agree on market conditions. If they don’t agree, that’s a sign to stay out, especially for inexperienced binary options traders.
A simple way to stay consistent is to force alignment before entering a trade:
- If you’re thinking mean reversion, you want stable conditions. You want controlled movement, clear range, and signs of slowing.
- If you’re thinking breakout, you want expansion. You want increasing volatility, strong candles, and clear push through levels.
If you see a mix, i.e. some signs of reversal and some signs of continuation, you’re likely in a transition phase. That’s one of the hardest environments to trade, especially with short expiries. For binary options, this matters even more because you don’t have time to be “eventually right”. If your idea is based on the wrong market condition, the trade can expire before the market proves you correct.
In short, don’t stack conflicting ideas and hope they cancel out into a good trade, because they usually don’t. Pick one logic, make sure the market actually supports it, and if it doesn’t, the best decision is often no trade at all.
Moving Averages and Directional Filters
Moving averages are among the oldest and most widely used tools in charting. They smooth the price data to show the underlying direction more clearly. In binary trading, they are useful mainly because they reduce the need to invent a market bias from candle mood.
A moving average is simply a rolling calculation of price over a fixed number of periods. Instead of reacting to every small fluctuation, it compresses recent price action into a single line that updates with each new candle. This “smoothing” effect filters out noise and makes it easier to see whether the market is generally drifting up, down, or sideways.
At the most basic level, a moving average is calculated by taking the closing prices of the last N candles and averaging them. For example, a 20-period moving average adds the last 20 closing prices together and divides by 20. When a new candle forms, the oldest value drops out of the calculation, and the newest one is added, and this is why it is called “moving”. The line on your chart is simply this calculation plotted point by point across time.
There are a few common variations, but they all follow the same idea with slight differences in weighting:
- A simple moving average (SMA) treats every price in the calculation equally.
- An exponential moving average (EMA) gives more importance to recent prices than to older prices within the time period.
- Other more exotic variations adjust sensitivity in their own ways, but the goal is always the same: to reduce noise and highlight direction.
The difference in weighting affects how quickly the line reacts to price changes. Faster-reacting averages follow price more closely but can be more “jumpy”. Slower ones are smoother but lag further behind the current price. Neither is universally superior; they just serve different purposes depending on how quickly you want to respond to market changes.
Using moving averages for trading commenced in earnest in the early 1900s, with market analyst Charles Dow as one of the main proponents. The moving averages originated in statistics and were later adopted into financial markets. Compared to the older Japanese version of technical analysis, this new Wall Street-focused method was more focused on defining and following trends, and smoothing prices into an average naturally fit that goal.
While the older Japanese methods focused chiefly on pattern recognition and candle structure, the moving averages method was about statistical smoothing. Both candlesticks and moving averages were used long before the advent of modern charting software, and today, many binary options traders combine candlestick analysis (from Japan) with moving averages (from Western technical analysis) on the same chart.
As mentioned above, one of the key figures in popularizing systematic market analysis was Charles Dow, whose work laid the foundation for trend-based thinking. Moving averages naturally fit into that framework because they visually represent trend direction in a simple, repeatable way.
What makes moving averages especially valuable for inexperienced traders is their ability to impose structure. Markets often look chaotic when viewed candle-by-candle, and beginners tend to overreact to individual moves. A moving average acts as a stabilizer. It won’t tell you exactly when to enter, but it helps answer a more important first question: What is the general direction now?
In short-term binary trading, this matters because your trades are time-limited. You don’t need to predict the entire future of the market; you just need to align with the most likely short-term direction. Moving averages help you stay on the right side of that bias by filtering out emotional interpretation and replacing it with a more dependable view of price.
There are two common ways binary traders use moving averages in short-term trading:
- One is the crossover method, where a faster-moving average crossing a slower one is treated as a signal that momentum or trend direction is changing.
- The other is to use a major average, often the 200 EMA, as a dynamic support or resistance barrier and a general trend filter.
Both approaches can work in the right setting, and both can also produce a surprising amount of nonsense if you look at them without proper context-based judgment.
Crossover Methods
A crossover method uses two moving averages with different speeds, often a fast average, such as the 9 EMA or 20 EMA, and a slower average, such as the 50 EMA. When the fast average crosses above the slow one, traders read that as bullish. When it crosses below, they read it as bearish.
The attraction is obvious. The signal is clear and easy to code into a rule for automatic trading. For binary traders who want structure, the clarity can feel reassuring, but moving average crossovers are lagging signals. By the time the crossover happens, part of the move has often already occurred. In binaries, where entry timing matters sharply, that lag can be costly.
Crossovers tend to work best in markets that are already trending cleanly. In those environments, the lag is tolerable because the trend has enough persistence to carry the trade. In choppy conditions, crossovers become messy. The averages twist around each other, signals flip back and forth, and the trader is whipsawed into low-quality entries. A crossover system that looks disciplined in a trend can look absurd in a range.
For binary use, crossover methods are often better as bias confirmation than raw entry signals. If the fast average has crossed above the slow average and the price is also making higher lows into a support retest, that is more useful than taking every bullish cross in isolation. The moving average helps answer which side of the market has the healthier structure, but candles and levels still need to do the timing work.
There is also the temptation to keep refining crossover settings until the chart looks cooperative. Traders adjust periods until yesterday’s trades look brilliant and then wonder why tomorrow’s market does not show the same courtesy.
Using the 200 EMA as a Dynamic Barrier
The 200 EMA has a special place in technical analysis because many traders watch it across multiple markets. It is often treated as a proxy for the longer trend or as a dynamic support and resistance zone. In binary trading, its value is usually less about magic and more about visibility. So many participants see it that price often reacts near it, especially on higher intraday or swing relevant charts.
When the price is above the 200 EMA and the average is sloping upward, many traders prefer to look for calls rather than puts, especially on pullbacks. When the price is below it, and the slope is downward, the bearish case tends to carry more weight. This is not because the line commands the market. It is because it provides a simple directional filter that keeps the trader from constantly arguing with the larger bias.
The 200 EMA can also act as a dynamic barrier. Price may pull back toward it, test it, and either bounce or reject from it. For binary traders, these reactions can provide more structured setups than trying to trade in the middle of open space. A bullish rejection from the 200 EMA in an overall rising market may support a call idea. A failure at the 200 EMA from below in a weak market may support a put.
Still, traders should avoid thinking about the 200 EMA as an iron wall. In strong moves, it can be sliced through, overshot, or ignored entirely for stretches. Its strength comes from context and crowd attention. A flat 200 EMA in a choppy market is often less useful than a clearly sloping one in a directional market.
Trend Filter vs. Entry Trigger
This distinction is one of the cleaner ways to keep indicators from causing damage. A trend filter tells you which side of the market deserves more attention. An entry trigger tells you when to act. Moving averages, especially larger ones like the 200 EMA, usually work better as filters than as precise entry devices.
A trader might, for instance, use the 200 EMA to decide that the market is broadly bullish and therefore focus mainly on call setups. The actual entry could then come from price pulling back into support, printing a bullish engulfing candle, or bouncing from a smaller moving average inside that larger trend context. That is cleaner than using “price touched the 200 EMA” as a complete trade thesis.
Likewise, a crossover can suggest the short-term trend has improved, but it does not necessarily mean the immediate candle is the best place to enter. Waiting for a pullback or a retest often gives a better strike and clearer structure. Binary traders who use moving averages as complete systems usually end up taking delayed signals with poor location. Those who use them as directional filters tend to make fewer but better-aligned trades.
Combining Indicators Without Overloading the Chart
In this article, we have talked a lot about the importance of looking at context and not letting one particular indicator make the decisions for you. With that said, inexperienced traders who try to avoid myopia sometimes fall into the trap of excessive indicator stacking, and that is also a bad habit that can cost a lot of money. You add RSI, Stochastic, Bollinger Bands, three moving averages, ATR, MACD, and why not a volume oscillator for luck, and suddenly your chart looks like a circus. The usual result is not a higher profit, but a trader who is confused about exactly why the account balance keeps dropping.
A simpler combination that you fully understand is often a superior choice. One momentum tool, one volatility tool, and one trend filter can cover most of what a short-term binary trader needs. For example, RSI for stretch, Bollinger Bands for volatility context, and the 200 EMA for directional bias. Or stochastic for range timing, ATR for regime awareness, and a faster moving average pair for short-term trend confirmation. The point is not the exact combination; the point is that each indicator should have a distinct job, and the overall combination should reduce the risk of bad choices.
Redundancy can sometimes increase confusion rather than correctly confirm a thesis. RSI and stochastic both speak about momentum and stretch, and using both is not always wrong, but it often adds two versions of the same opinion. Likewise, loading several moving averages on the chart can create the illusion of depth while mostly repeating the same idea at different speeds. When indicators agree because they are mathematically similar, that agreement is less informative than it appears. If you need more support for a thesis, the answer is not to add more lines until the uncertainty is hidden. The answer is to use a few tools clearly.