Oil Prices Set To Rebound
The global energy markets have been under a lot of pressure lately as mounting oversupply worry and slowing GDP growth combine to scuttle the 2018 rally. WTI and Brent are both down more than 30% from their 2018 highs and may continue lower in the near-term as traders wait to see just how far oil prices can fall.
Crude Sell Off Overextended And Ready To Snap-Back
The spark that set off the decline was a massive rise in US production. The US has been steadily increasing production over the past 2 years and hit an all-time high over 11 million barrels per day within the last two months. A slight down-tick in production during October is blamed on a round of devastating hurricanes and not expected to pose a long-term problem, a problem that has OPEC talking up another production cut. The last time OPEC cut production the price of WTI and Brent advanced nearly 100% before topping out.
According to EIA projections for production and consumption both are expected to steadily rise over the next few years. The agencies estimated price for WTI in 2019 is $64.85 which represents a minimum 20% increase over the course of the next twelve months. Along with OPEC cutting production (expectedly), there are some demand issues that will help drive prices higher as well, the number one being onset of winter weather conditions.
Based on the Farmers Almanac and other weather predictions the 2019 winter season is going to be a cold one. The EIA is expecting 2019 winter heating bills to be slightly higher than they were for winter 2018 which suggests prices will rise in the near future. Another factor traders need to consider is accelerating economic development in emerging markets in Africa, Asia, and South America.
The Technical Picture Is Weak (for the bears)
The technical picture does not support the sell-off in oil. The price of both WTI and Brent have reached strong support targets ($50-$52 for WTI and $60-$62 for Brent) and the indicators are consistent with that support. Both MACD and stochastic are diverging from the new lows and have been the duration of the Oct/Nov sell-off and stochastic is indicating reversal.
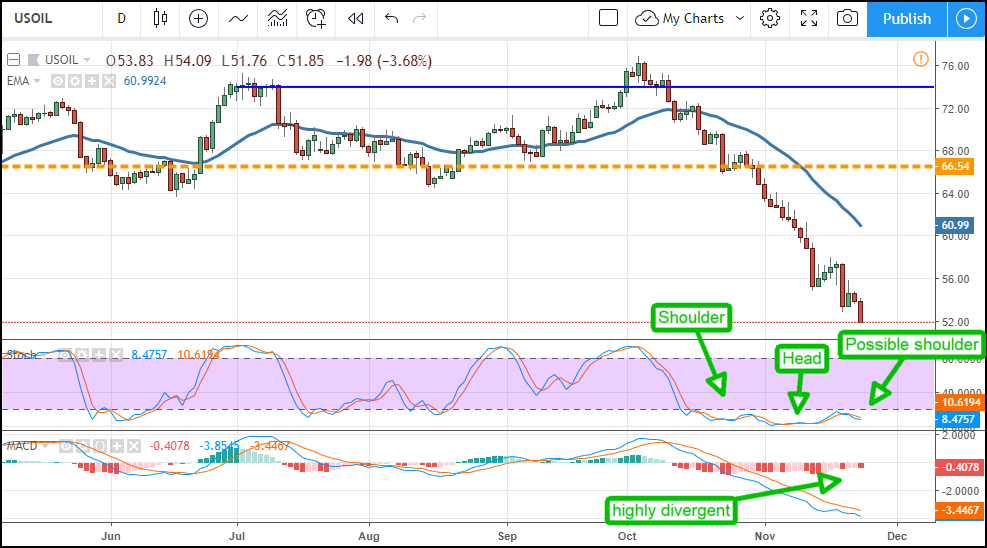
The stochastic has not only diverged from the lows, it is tracing out a Head and Shoulders reversal pattern (yes, indicators can do that too) that has the indicator set up to fire a strong bullish crossover. The caveat for traders is that near-term bearish pressure may continue, waiting for a solid confirmation of support and reversal signal in the candles is crucial. Once support is confirmed, a rally back to $60 or even $66 is expected.
The Risks
The risk is geopolitical. US President Donald Trump has been supportive of the Saudi Government during the Jamal Khashoggi Murder scandal and that may result in concessions from the Saudi’s. One such concession would be support for lower oil prices. President Trump wants lower oil prices, has asked (Tweeted, bullied and badgered) the Saudi’s and OPEC to maintain current production levels or even increase them, and if they do oil prices will have a harder time rebounding.