How to Trade Binary Options 4: Market Analysis II – Technical Charting
Technical analysis in binary options is about more than direction. You are not just trying to answer where the price may go next; you are trying to find out if the price is likely to be above or below a certain level at a specific moment in time. That difference sounds small, but it changes how charts can be used.
A spot forex trader or stock trader can survive a poor entry if the broader direction is right and there is room to manage the trade as the market unfolds. With a classic High/Low binary option, on the other hand, the exact expiry moment is everything. The binary options contract expires on schedule, whether the chart has finished making sense or not. Because of that, the chart patterns that matter most in binaries are often the patterns that say something about exhaustion, rejection, momentum loss, or whether a level is holding now rather than whether it might matter later in the week.
Candlestick shapes, support and resistance, trend structure, and timeframe alignment are useful because they reduce guesswork around immediate price behavior, but none of them are magic or can tell the future with 100% accuracy. All of them can fail.
Technical charting in binary options is about reading immediate price behavior with enough discipline to avoid treating every flicker as a signal. Candles can help reveal rejection and momentum shifts. Support and resistance levels help show where the market has memory. Trend structure tells you which side is controlling the sequence. Using the appropriate timeframes helps you spot what is noise and what isn’t. Visual patterns can help you organize periods of pause, continuation, and reversal.
None of this removes risk. It just gives you a bit more information to build your analysis on. In a fixed expiry product, that matters. A trader does not need the chart to be clever, but technical analysis can help us see things more clearly and reduce the amount of random decisions we make based on pure hope and gut feelings.
Here’s where you are in our 10-step guide to trading binary options:
- The Foundations of Binary Options
- Regulatory Landscape and Safety
- Market Analysis I – Fundamental Drivers
- Market Analysis II – Technical Charting
- Technical Indicators for Binary Options Trading
- The Three Pillars of Binary Options Strategy
- Timeframes & Expiry Management
- Money Management & Probability
- The Psychology of Binary Trading
- Advanced Implementation & Tax Compliance
Candlesticks & Volatility
A candlestick is a summary of certain prices over a fixed period. It shows the opening price, the closing price, the high, and the low. That sounds basic, but in practice, a candlestick is not just data compression. It can be viewed as a type of visual record of how one side gained control, lost control, or fought the other side to a draw during that interval.
For binary traders, the body of the candle is not without consequence, but the wick often matters considerably more. The body shows where the price opened and closed. The wick shows where the price traveled and where it was rejected. In a product where short-term direction and timing are everything, rejection is often more useful than raw movement. A large bullish candle can look strong until you notice a long upper wick showing that buyers pushed higher and then lost control before the close. A small candle can look harmless until you realize it formed after several failed attempts to break a level. In chart reading, the small details can reveal very important dynamics.
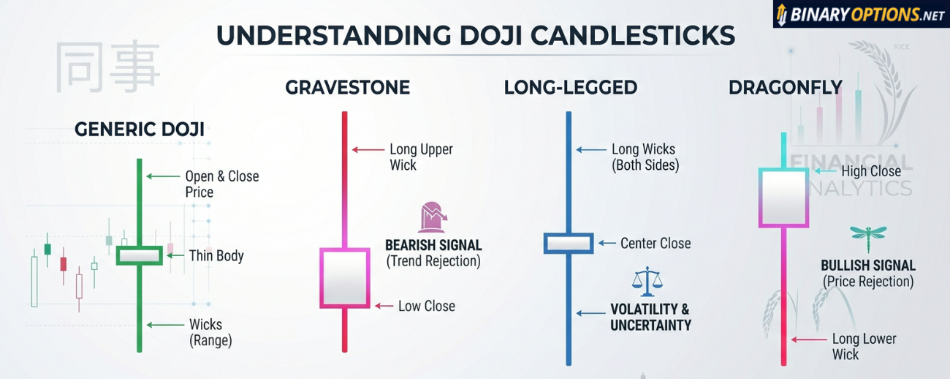
A Doji Is a Type of Candlestick
A doji is a type of candlestick. It forms when the opening and closing prices are the same or nearly the same, which makes the candle’s body very thin, sometimes just a line. While the candle body is small, sometimes barely visible, the wick (shadow) can vary in size, and be long or short depending on how much the price moved during that period. The usual interpretation for a doji is indecision. Buyers and sellers pushed, but neither side won clearly by the close.
Traders often pay attention to dojis because they can hint at a possible reversal or pause, especially after a strong uptrend or downtrend. But on their own, they’re not a very dependable signal type, and you usually need confirmation from other indicators.
In Japanese, “doji” (同事) means “the same thing” or “unchanged.” That name fits the pattern of opening and closing prices being essentially the same, and nothing really having changed by the end of the period, even though the price may have moved up and down in between. Many candlestick terms have Japanese names, and candlestick charting itself was developed by Japanese rice traders a long time ago.
In binary options, a doji is less a signal to trade than a warning to slow down. At a key support or resistance level, a doji can show that the current move is running out of conviction. If price has been trending higher into resistance and then prints a doji, that does not automatically justify a put. What it does say is that the clean upward push may be stalling. Likewise, a doji at support does not automatically justify a call, but it may suggest sellers are no longer pressing with the same confidence.
This matters because many binary losses come from reading momentum as permanent. A doji is often the chart’s way of telling you to be careful. In a fixed expiry product, a doji matters more than in ordinary chart trading because the binary options trader can not decide to hold the position open through a messy pause and wait for the pattern to mature.
If the next candle breaks clearly above or below the doji and confirms direction, that can be useful. The doji by itself is usually not enough. You also need to pay attention to the location of the doji. A doji in the middle of random intraday noise is not worth much. A doji after an extended run, or right at a level with prior reactions, is worth more attention. Context is incredibly important. The “clue” is less “this will happen” and more “this is how the battle played out, and this side might be weakening”.
Differently shaped dojis have different names, and each type gives slightly different clues about what happened during that trading period.
- Gravestone doji (long upper wick). This type of doji forms when the price moved up strongly, and sellers then pushed it all the way back down to near or at the open. Buyers tried to take control but failed. This is a potentially bearish signal, especially after an uptrend. It suggests rejection of higher prices.
- Long-legged doji (long wicks on both sides). The price swung widely up and down, but ended at or near the open. There was high volatility and total indecision; neither side could dominate. This pattern typically signals uncertainty or a possible turning point. It is weaker directionally than the gravestone and the dragonfly.
- Dragonfly doji (long lower wick). The price dropped sharply, but buyers stepped in and pushed it back up to the open. Sellers lost control, and buyers recovered. This is potentially a bullish signal, especially after a downtrend. It shows rejection of lower prices.
Engulfing Patterns: When a Strong Candle Fully Covers the Body of the Previous Candle
When a strong candle fully covers the body of the previous candle, we call it an engulfing pattern.
- In a bullish engulfing setup, a down candle is followed by a larger up candle that closes above the prior body.
- In a bearish engulfing setup, an up candle is followed by a larger down candle that closes below the prior body.
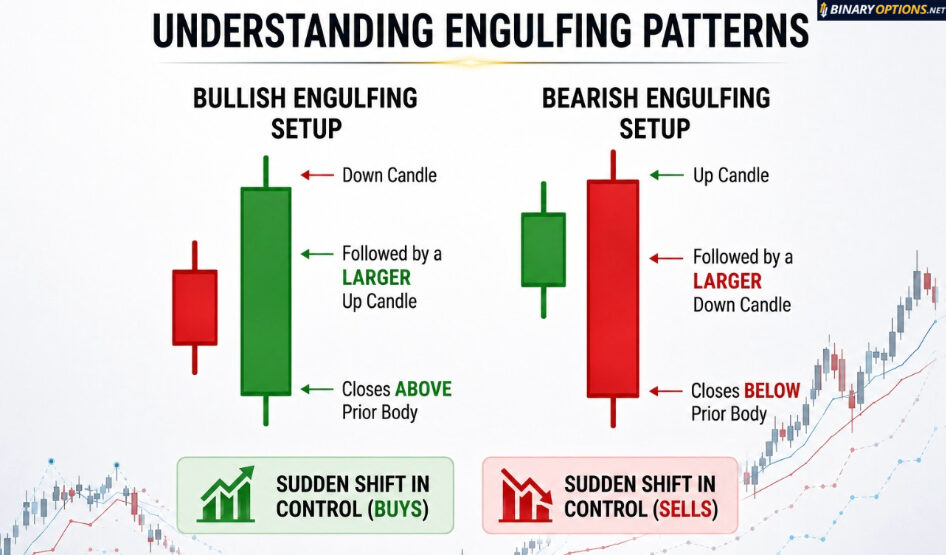
The appeal of engulfing patterns is that they show a sudden shift in control. A market that looked weak is abruptly bought. A market that looked strong is abruptly sold. For binary traders, that kind of momentum shift can be useful because it combines directional information with immediacy. The trade is not based on a vague theory that momentum may turn later. The turn, or at least the first hard attempt at one, is already visible on the chart.
That said, engulfing patterns are only considered high-quality when they occur at logical turning points. A bullish engulfing candle after a long decline and into clear support means more than the same pattern printed in the middle of a messy range. A bearish engulfing candle at the edge of a rising market and near resistance is more relevant than one appearing after two random candles in low volume chop. Both shape and location must be taken into account.
For a binary trader using short to medium intraday expiries, engulfing patterns often work best as confirmation rather than as standalone reasons to enter. Suppose price tests a prior support zone, rejects lower levels, and then forms a bullish engulfing candle on the five-minute chart. That is a more complete setup than simply seeing the engulfing candle and clicking call because the candle looks authoritative.
We must also remember that some engulfing patterns are too large to be useful for short expiries because the move has already traveled a fair distance by the time the pattern is complete. Entering late on a binary contract can turn a good chart read into a poor strike. Inexperienced traders often forget that technical patterns do not exist in isolation from entry quality. You can have read the chart correctly and still suffer because you were late to the indicated move.
Exhaustion Candles (Pin Bars)
An exhaustion candle, often called a pin bar, is a candle with a small body and a long wick. The long wick shows that the price pushed hard in one direction and then was rejected. In plain English, the market tried to go somewhere but did not succeed.
For binary traders, pin bars are useful because they reveal failed aggression.
- A long upper wick near resistance suggests buyers managed to push the price higher but could not hold it.
- A long lower wick near support suggests sellers drove the price down and then lost control.
- In both cases, the wick records an attempted breakout that failed during the candle’s life.
This is why pin bars are often used for short reversal style setups. A pin bar at resistance can support a put idea. A pin bar at support can support a call idea. But again, the location is doing most of the work. A random pin bar in the middle of a noisy market is often just noise. A pin bar at a level that the market has respected before can be more useful.
For five-minute or fifteen-minute binary expiries, exhaustion candles can be especially relevant because they suggest the immediate push has already failed. That aligns better with the fixed expiry structure than some slower technical patterns follow. Still, traders should be careful about using a single candle for their forecasts. An exhaustion candle can mark the start of a reversal, or it can simply mark a pause before the original move continues. In strong trends, pin bars against the dominant direction can fail repeatedly. That is why the candle must be analyzed with the larger structure.
Understanding Support and Resistance: The Market’s Floor and Ceiling
Support and resistance remain central to binary trading because fixed expiry contracts are often won or lost at levels where price has reacted before. But it is not easy. In non-binary trading, a poor level can sometimes be managed with a stop adjustment or more patient holding. In binaries, there is less room for forgiveness. If the trade is entered near a level that the market is likely to reject, the trader may be fighting the chart and the clock at the same time.
- Resistance is the area where selling pressure has previously been strong enough to cap advances. You can think about it as the ceiling.
- Support is the area where buying interest has previously been strong enough to halt or reverse declines. You can think about it as the floor.
These are not exact lines in the way beginners often want them to be. They are better treated as zones. The price can not be expected to stop neatly because it reaches a certain spot. Instead, you can expect it to push into levels, test them, overshoot them, and then sometimes reverse anyway. Traders who insist on exact points usually end up learning the difference between neat theory and messy reality the expensive way.
Historical Pivots
A historical pivot is a place on the chart where the price has turned before, often more than once. The logic is simple enough. If the market reacted there previously, it may react there again because participants remember the area, resting orders may cluster there, or the zone still represents a meaningful valuation or liquidity point. As explained above, it is better to think about this as a zone, rather than a single point.
For binary traders, historical pivots matter because they offer structure. A call taken into a proven support zone has a different logic from a call taken in the middle of nowhere. A put taken just below a resistance zone that has already rejected price twice has more behind it than a put based only on one red candle after a long rise. Structure does not guarantee success, but it can improve the chance.
There is a trap here, though. The more often a level is tested, the more important it becomes, but it can also become more fragile at the same time. Repeated tests can strengthen the case that the market cares about the level. They can also weaken the level over time as orders are absorbed. This is why a level that has held three times can look indestructible right before it breaks hard. Beginners often read multiple tests as permanent proof, but they can just as well be a sign that pressure is building.
For binaries, that means a trader should not assume that buying every bounce from support or selling every rejection from resistance is a sustainable habit. The quality of the reaction matters. Each new test needs to be read carefully. Is the bounce getting weaker? Is the rejection getting shallower? Is momentum building into the level? Is volume or volatility expanding? Levels are not static objects; they are ongoing dynamics.
Psychological Levels
Psychological levels are round numbers that attract attention because traders, funds, and algorithms all tend to notice them. In forex, levels such as EUR/USD 1.1000 or USD/JPY 150.00 draw interest. In indices and cryptocurrency, round numbers do similar work. These levels often matter because humans like round numbers, and large order clusters often gather around them.
For binary traders, round numbers are useful because they tend to act as obvious reference points for short-term price behavior. A market approaching a big round level may hesitate, fake out, reject, or accelerate once the level finally gives way. That makes such levels relevant both for reversal setups and breakout setups. The same price zone can function as a barrier one hour and a trigger point the next.
The danger is assuming round numbers matter by themselves. They matter when the market is already paying attention to them. A drift through a round level in a thin session may mean little. A hard test of the same level during a major session or after important news may mean much more. Once again, the chart needs to be read with context in mind. Binary traders who reduce technical analysis to “round number equals reversal” tend to erode their account balance fairly quickly.
There is also a practical point about strike placement. If the broker’s strike sits right on or very near a widely-watched psychological level, the trade may be more fragile than it first appears. Those levels attract volatility and indecision, which is not ideal if the expiry is close. Sometimes the best trade near a major round number is the one not taken.
Role Reversal
Role reversal is one of the more useful ideas in plain charting. When support breaks decisively, it often becomes resistance on a later retest. When resistance breaks, it often becomes support. The logic is behavioral. Traders trapped on the wrong side of the break may use the retest to exit, while new participants may defend the level in its new role.
For binary traders, it can be good to know that the retest after a break is often (not always) cleaner than the initial breakout itself. Breakouts can be noisy, false, or driven by one sharp burst that leaves a poor entry. The retest gives the chart a chance to prove that the old level has actually changed function. A broken support level that is retested and rejected from below can offer a much more structured put setup than trying to guess the breakout candle in real-time. The same applies in reverse for calls after resistance flips into support.
This approach suits the fixed expiry nature of binaries because the retest often creates a more defined immediate reaction zone. The trader is no longer betting on whether the market can force a break from scratch. The market has already done the hard part, and the trader is now asking whether the level will hold in its new role for long enough to carry the contract to expiry. Cleaner question and usually better odds.
That said, it’s important to treat role reversal as a tendency within technical analysis, not a law of market behavior. Markets do not “owe” you a retest, and they do not have to respect a level just because it was important in the past.
For short-term binary traders, a few practical realities matter:
- Not every breakout retests: Strong moves can continue without looking back. Waiting for a retest can mean missed trades, but chasing without structure often leads to worse outcomes. There is always a trade-off.
- Some retests fail completely: Price may break a level, return to it, and then push straight through in the opposite direction, invalidating the role reversal idea. This is common in choppy or low-conviction markets.
- Weak breaks are more likely to fail: Weak breaks (small candles, no momentum, lots of overlap) are far more likely to fail. Cleaner role reversal setups usually come after a strong displacement (clear push away from the level), minimal hesitation around the break, and follow-through before the retest.
- Time matters more in binaries than direction alone: Even if the level holds, price might stall near the level, drift more slowly than you expected, or react too late for your binary option to expire in the money. In binary options, you need the move to happen within a fixed window, not just eventually. Therefore, a correct idea about direction can still lose by being just a few seconds too late.
- Noise increases on lower timeframes: As mentioned before, the shorter the timeframe, the more unreliable the levels become. What looks like a clean break-and-retest on a 1-minute chart may just be a random fluctuation. Confluence (higher timeframe levels, session context, or repeated tests) improves reliability.
- News and volatility can override structure: Scheduled events or sudden volatility spikes can blow through support/resistance levels without respecting prior behavior. Role reversal tends to work better in stable conditions than during erratic moves.
Role reversal doesn’t predict what must happen; it only highlights a location where a reaction is more likely. Your job is not to assume the level will hold, but to watch how the price behaves when it gets there. For binary setups, the highest-quality scenarios usually combine a clear break, a controlled retest, a visible rejection (not just a touch), and enough space and momentum for price to move before expiry.
Used this way, role reversal becomes less about belief and more about framing a structured, time-sensitive decision under uncertainty.
Trend Dynamics: The Market Bias
Trend analysis matters in binary options because fighting the dominant move is one of the easiest ways to burn through a string of small fixed losses.
- An uptrend is usually defined by a sequence of higher highs and higher lows.
- A downtrend is defined by lower highs and lower lows.
These terms are simple, but traders often ignore them in favor of vague statements such as “it feels bullish” or “it looks stretched.” Price structure is more useful than feeling. In a leveraged spot trade, a counter-trend position can sometimes work if timed well and managed carefully. In binaries, the room for error is smaller. The trader needs not only a reversal, but a timely one.
Higher Highs and Higher Lows
In an uptrend, price pushes to a new high, pulls back, then holds above the prior meaningful low before rising again. That sequence tells you two things:
- Buyers are strong enough to force new highs, and
- Sellers are not strong enough to push the pullback below the last important swing low.
As long as that structure remains intact, the bullish bias is still there, whether or not each candle is pretty.
For binary traders, this matters because calls aligned with an uptrend generally have better odds than calls taken randomly in a flat or falling market. That does not mean every bullish candle should be bought. It means that when price pulls back into support and then shows a bullish trigger, the trader is working with the market’s existing bias rather than asking for a full reversal on demand.
Patience and self-control are important. Many traders lose money by chasing candles in the middle of trend legs rather than waiting for the pullback. In binaries, chasing often means taking poor strikes after much of the immediate move has already happened. A trader who waits for a higher low to hold, and then uses a candle pattern or smaller timeframe trigger, usually has a more rational entry than one who clicks because the last candle was green and exciting.
Lower Highs and Lower Lows
A downtrend is the mirror image. Price makes a new low, bounces, fails below the prior important high, and then sells off again. Sellers are proving they can push the market lower, while buyers are failing to recover enough ground to change the structure.
For binary traders, puts in a downtrend tend to be cleaner than calls attempting to pick a bottom. The reason is not mystical. Markets in decline often produce sharp, tempting rebounds that look like reversals until the next leg lower begins. Binary traders who repeatedly buy calls against a downtrend often end up paying for hope more than analysis. This is especially relevant on short expiries, where a trader may see one bullish candle in a falling market and mistake it for a turning point. Sometimes it is only profit-taking or a temporary liquidity pause. Without a structural shift, the larger bearish bias is still in control. The chart does not care that the counter-trend candle looked brave.
The Break of Structure (BOS)
A break of structure, often shortened to BOS, occurs when the trend fails to maintain its normal pattern. In an uptrend, that might mean price fails to make a new higher high and then breaks below the prior higher low. In a downtrend, it might mean price breaks above the prior lower high. This is the chart’s way of saying the old trend is no longer operating cleanly.
For binary traders, a break of structure is often less a signal to reverse immediately and more a signal to stop trading the old direction as if nothing has changed. If an uptrend breaks below its prior higher low, blindly buying every small dip becomes much less sensible. The trader should now wait to see whether the market forms a lower high and begins behaving bearishly. Likewise, if a downtrend loses its lower high structure, blindly selling every bounce becomes riskier.
This “wait for the retest” mentality matters because breaks in structure can produce false starts. A market can briefly violate a level and then snap back, especially around news or low liquidity periods. Binary traders who react to every tiny structural breach as if it were a regime change will get chopped up. A break matters most when it is clear, visible on a sensible timeframe, and followed by price action that confirms the shift.
Visual Patterns: Consolidation and Breakouts
Generally speaking, financial markets are unlikely to move in straight lines for long. They have a tendency to pause, compress, and rotate inside ranges before the next directional move begins. These consolidation periods matter a great deal in binary options because they often create the floor and ceiling conditions from which short-term contracts are traded.
The broader lesson with visual patterns is that consolidation is normal, breakouts are selective, and reversal patterns need proof. A chart pattern should clarify what the price is doing. If the pattern only makes sense after five minutes of complex explanation, it is probably not the kind of structure a binary trader should be staking money on.
Rectangle
A rectangle, or basic range, forms when price bounces between a horizontal support zone and a horizontal resistance zone. For binary traders, ranges can offer two different styles:
- One is range trading, where calls are considered near the lower boundary and puts near the upper boundary, provided the boundaries are still holding, and the market is not building obvious breakout pressure.
- The other is breakout trading, where the trader waits for the range to fail and then looks to trade the move away from it.
Range trading can suit binaries because the boundaries create clear reference levels. The danger is that every successful range eventually teaches traders the wrong lesson. It works until it does not. The more comfortable the market looks inside the box, the more violently it can move when the box finally breaks. Traders who keep fading the edges after momentum has shifted are taking very high risks.
Flags and Pennants
Flags and pennants are continuation patterns that appear as short pauses inside stronger trends. A bull flag often forms after a sharp rise, followed by a shallow downward or sideways drift before the trend resumes. A bear flag does the opposite.
These patterns are useful in binaries because they offer a structured pause inside an existing directional move. Rather than chasing the impulse candle, the trader waits for the pause and looks for signs that the trend is resuming. Again though, the pattern works only in context. A so-called flag in a choppy range is not a flag in any useful sense. Continuation patterns need a real prior impulse and a contained pause. Otherwise the trader is seeing shapes because the brain likes shapes, not because the market is communicating anything clear.
Head-and-Shoulders
Head and shoulders patterns sit in the reversal category. The classic version forms after an advance: a left shoulder, a higher head, and then a right shoulder that fails to push beyond the head. The neckline beneath the pattern acts as the key support zone. If it breaks, the pattern suggests buyers have lost control, and a bearish shift may be developing.
For binary traders, head and shoulders patterns can be useful, though only when they are obvious enough to matter. Many supposed head and shoulders formations are just random lumps drawn hopefully by traders desperate for a turning point. A good pattern is not just symmetrical. It appears at a logical place, after a genuine prior trend, and its neckline matters because price has reacted there.
Chart Timeframes: Don’t React to Static
One of the most common mistakes in binary trading is staring only at the execution chart. A trader opens the one-minute chart, sees movement, and starts treating every candle as if it contains the whole truth. It does not. Lower timeframes show more detail, but they also show more noise. Without context from higher timeframes, the trader is often just reacting to static.
Multi-timeframe analysis helps solve this by giving each chart a specific job. The higher timeframe provides context. The middle timeframe identifies levels and structure. The lower timeframe is used for precise entry. This is not a fancy institutional secret; it is a basic routine for chart reading.
A common approach for day traders is to use the one-hour chart as the anchor. This chart helps answer the broad question: is the market trending, ranging, or sitting near a major level? The five-minute or fifteen-minute chart can then be used to mark support and resistance, swing points, and cleaner candle patterns. The one-minute chart is left for execution only, which means it is used to refine entry rather than to invent the trade idea from scratch.
This matters because a bullish signal on the one-minute chart can be meaningless if the one-hour chart is pressing into heavy resistance. A bearish pin bar on the one-minute chart can be low value if the fifteen-minute chart has just broken upward from a major range. Without timeframe alignment, traders often end up taking beautiful tiny signals in ugly larger contexts.
The fractal nature of charts complicates this further. Similar patterns appear on many timeframes. A head-and-shoulders can form on a one-minute chart and on a four-hour chart. A pin bar can matter on both. But the reliability is not the same. Generally, the lower the timeframe, the more noise contaminates the pattern. A doji on a four-hour chart reflects four hours of conflict. A doji on a one-minute chart can reflect little more than random noise. For binary traders, this does not mean the one-minute chart is useless. It means the one-minute chart needs to be used only for certain specific tasks. It is a tool for timing, not for worldview. Traders who build their entire analysis from the noisiest chart tend to wipe out their accounts pretty fast.
Is Technical Analysis Reliable?
Technical analysis (TA) is often presented as a structured way to read markets, but it is very important to understand what it is and what it is not. Technical analysis sits somewhere between empirical craft and applied behavioral study, grounded in observation but lacking the kind of universal, testable laws you’d expect in hard sciences like physics. To understand what technical analysis is and how it can be utilized, it helps to look at where it came from and how it behaves in practice, including how it can be implemented in a reasonable way in the context of binary options trading.
Technical analysis studies price movement, primarily through charts, to anticipate future behavior. It relies on patterns, levels, and indicators derived from past price data. It involves a lot of uncertainty, but it is not random. The foundations of technical analysis draw from observable regularities in human behavior, especially crowd psychology. Concepts like trends, momentum, and support/resistance persist because market participants tend to act in somewhat predictable ways under uncertainty. Technical analysis can therefore correctly be described as an applied probabilistic framework built on historical observation and behavioral tendencies, but it is not a hard science with fixed laws.
Simplistic get-rich-quick tutorials sometimes try to market technical analysis as “a sure thing”. In essence, inexperienced traders are told that if they spot this signal, this will happen to the price. That is especially common when someone is trying to sell a signal service subscription or similar, claiming it is built on advanced technical analysis and therefore essentially infallible. Anyone who knows a bit more about what technical analysis actually is, and how it works, will be hard-pressed to trust these sketchy salespeople and their overconfident sales pitches.
How Technical Analysis Emerged and Evolved
The history of technical analysis doesn’t begin on Wall Street; it actually has deep roots in early commodity trading, especially in Japan’s speculative rice markets. During the Edo period (1603–1868), rice was more than just food in Japan; it functioned as a store of wealth and medium of exchange. Samurai were often paid in rice, and large rice warehouses issued receipts that could be traded. Over time, this led to organized markets where rice was bought and sold not just for consumption, but for speculation on future prices.
A key location in this development was the Dojima Rice Exchange, established in the 18th century and often considered the world’s first organized futures exchange. Traders there were already engaging in forward contracts (agreements on future delivery), speculation based on expected price movement, and active trading of standardized receipts. This environment created a need for better ways to track and interpret price behavior, which is why technical analysis was developed.
One of the most famous figures from this period is Munehisa Homma (also known as Sokyu Honma), an 18th-century rice trader from Sakata. Homma is often credited, though some details are debated, with developing early forms of what we now call technical analysis. His approach went beyond just tracking prices. He emphasized the importance of market sentiment, the emotional behavior of traders, and the idea that prices reflect psychology, not just supply and demand.
He is associated with what later became known as the “Sakata Rules”, which is a set of principles for interpreting market behavior. One of his most forward-thinking ideas was that markets are driven as much by human emotion as by fundamentals, and that idea is still central to modern technical analysis.
From this rice trading culture emerged one of the most recognizable tools in modern TA-based trading: candlestick charts. Candlestick charting is widely believed to have originated from traders like Homma and others in these rice markets. Instead of just recording closing prices, candlesticks show open, high, low, and close. Recognizing different candlestick patterns were early attempts to read market psychology directly from price action, which is a core idea in technical analysis today.
In the United States, technical analysis was moulded and broadened into the modern version that we are using today. One of the foundational figures is Charles Dow, co-founder of The Wall Street Journal. In the late 19th and early 20th centuries, he developed what became known as Dow Theory, which introduced key ideas still used today: Markets move in trends. Trends have phases. Price action reflects all known information.
Later contributors expanded on these ideas. Examples of notable names are Richard Wyckoff, who focused on supply and demand dynamics and “smart money” behavior and Ralph Nelson Elliott, who proposed wave patterns driven by crowd psychology.
Even though candlestick patterns had been known in Japan for a very long time, they did not become widely known among traders outside Japan until the late 20th century. A major figure in this transition was Steve Nison, who introduced Japanese candlestick techniques to a broader audience through his books and seminars in the 1980s and 1990s. Before this, Western technical analysis focused more on trend analysis, averages, and broad market structure. Candlesticks added a more granular, visual layer, especially useful for short-term decision-making, and it is not surprising that many binary options traders use candlesticks extensively today.
Technical developments have also had a huge impact on the TA field. The rise of computers in the late 20th century led to the widespread use of indicators like moving averages, RSI, and MACD over time. TA is split into multiple approaches, including classical charting, indicator-based systems, and quantitative and algorithmic trading methods built on TA. Despite the many modern and tech-driven developments within the field of technical analysis, the core idea still remains the same: past price behavior may offer clues about future price behavior.
What This History Tells Us About Technical Analysis
Looking at its origins in Japanese rice markets and the further developments that took place in environments such as Wall Street helps us clarify what technical analysis really is and what it is not.
Technical analysis is a tool developed by traders who needed help to navigate uncertainty. It is a way to interpret crowd behavior through price action, and modern technical analysis includes an evolving set of techniques shaped by real market use.
Technical analysis is not a modern invention designed by financial institutions: it is not a scientific system with fixed rules, and it is not a guaranteed method for predicting prices. In its earliest form, just like today, technical analysis has always been about observation, adaptation, and probability, and it has never offered 100% certainty.
Technical Analysis For Binary Options Traders
A strength of technical analysis is that it can be applied across markets, e.g. forex, equity, commodities, and cryptocurrencies. Technical analysis focuses on what the market is actually doing and takes the stance that since price reflects all executed trades, it is the most immediate source of information.
Technical analysis can be very helpful when utilized to organize market information visually, identifying probabilities and trade locations, and structuring risk and timing decisions. It is not a predictive system with guaranteed outcomes or a replacement for understanding volatility, liquidity, and context. Two traders can look at the same set of charts and draw very different conclusions.
Compared to e.g. conventional forex spot trading or buying and selling stocks, binary options introduce a constraint that fundamentally changes how technical analysis needs to be used: the fixed expiry and how only this point in time matters. In traditional trading, being directionally correct is often enough. In binaries, you must be correct on direction and correct on precise timing, and this amplifies both the strengths and weaknesses of technical analysis.
In binary trading, technical analysis can be helpful when it comes to defining reaction zones, avoiding poor entries, and framing probability. Concepts like support/resistance and role reversal help identify areas where price is likely to react, and that is useful for setting up trades with short-term expectations and a clear structure. When used correctly, technical analysis can also help traders avoid chasing breakouts, entering in the middle of ranges, and trading during exceedingly indecisive conditions.
But there are also many examples of challenges where technical analysis can fall short in binary trading. A setup can be correct in principle and still fail because binary options need the price to be right at exactly the right second. This is important to remember, since technical analysis was not developed for this type of contract. Japanese rice traders and 20th-century Wall Street stock speculators did not need the price to be above a certain point exactly five minutes from now. Short-term timeframes (for binaries or any other type of trading) also introduce more noise.
As always, the fixed payouts of a classic binary option, where you risk $100 to make a profit below $100, require a high win rate to maintain profitability over time, and even small inefficiencies in technical analysis can erode your account.
There are also the psychological traps, where technical analysis leads to false confidence, and you start to believe that this particular level will hold forever, and this pattern works in any context. In reality, no setup is immune to failure.
A Grounded Way To Use Technical Analysis
Instead of treating technical analysis as a predictive science, it’s more useful to treat it as a decision-making framework for operating under uncertainty.
For binary traders, this can mean:
- Focusing on high-quality locations, not constant trading
- Waiting for clear reactions, not just touches
- Aligning setups with short-term momentum
- Accepting that even strong setups fail and have room for this in the trading strategy
The goal is not to eliminate uncertainty, because that’s impossible, but to structure it in your favor.
Technical analysis has endured for such a long time because it captures something real. Markets are driven by behavior, and behavior leaves patterns. But those patterns can be inconsistent, context-dependent, probabilistic, and difficult to interpret correctly. Technical analysis can be helpful for a binary options trader who treat it as a flexible framework, but it has a tendency to quickly drain the accounts of traders who use it as if it were a set of firm rules that forcefully determine future prices.