El Salvador & Bitcoin: The Love Story 1 Year Later
Fresh Breakout or the Downtrend’s Swan Song?
Approximately 1 year ago, El Salvador decided to make Bitcoin legal tender but the value of the country’s holdings has dwindled ever since. Following the demise of the FTX exchange, Bitcoin dropped below $16K for the first time since November 2020; roughly one week later, it is trading at $16,770.
Bitcoin’s adoption in El Salvador has been criticized by international and domestic voices, yet President Nayib Bukele continued to be a massive crypto supporter. Unfortunately for El Salvador’s holdings, Bitcoin’s All-Time High came very soon after its adoption. According to Bitstamp data (via TradingView), on November 10, 2021, BTC/USD reached $69,000 and has been dropping ever since.
El Salvador currently owns 2,381 BTC and the unrealized loss is more than $65 million. Despite this, President Bukele recently announced that the country is going to start buying 1 Bitcoin each day. On November 17 he tweeted: “We are buying one #Bitcoin every day starting tomorrow.”
To show his support of the initiative, Justin Sun (Tron founder) announced that TRON DAO will also buy 1 Bitcoin a day: “We echo @nayibbukele’s initiative in buying #Bitcoin daily. We will also buy one #Bitcoin everyday starting tomorrow!”
This buying spree will quickly increase El Salvador’s Bitcoin holdings and although the market is bearish right now, the next bull cycle will come eventually. The question remains though, when will that be, and at what price will the drop stop?
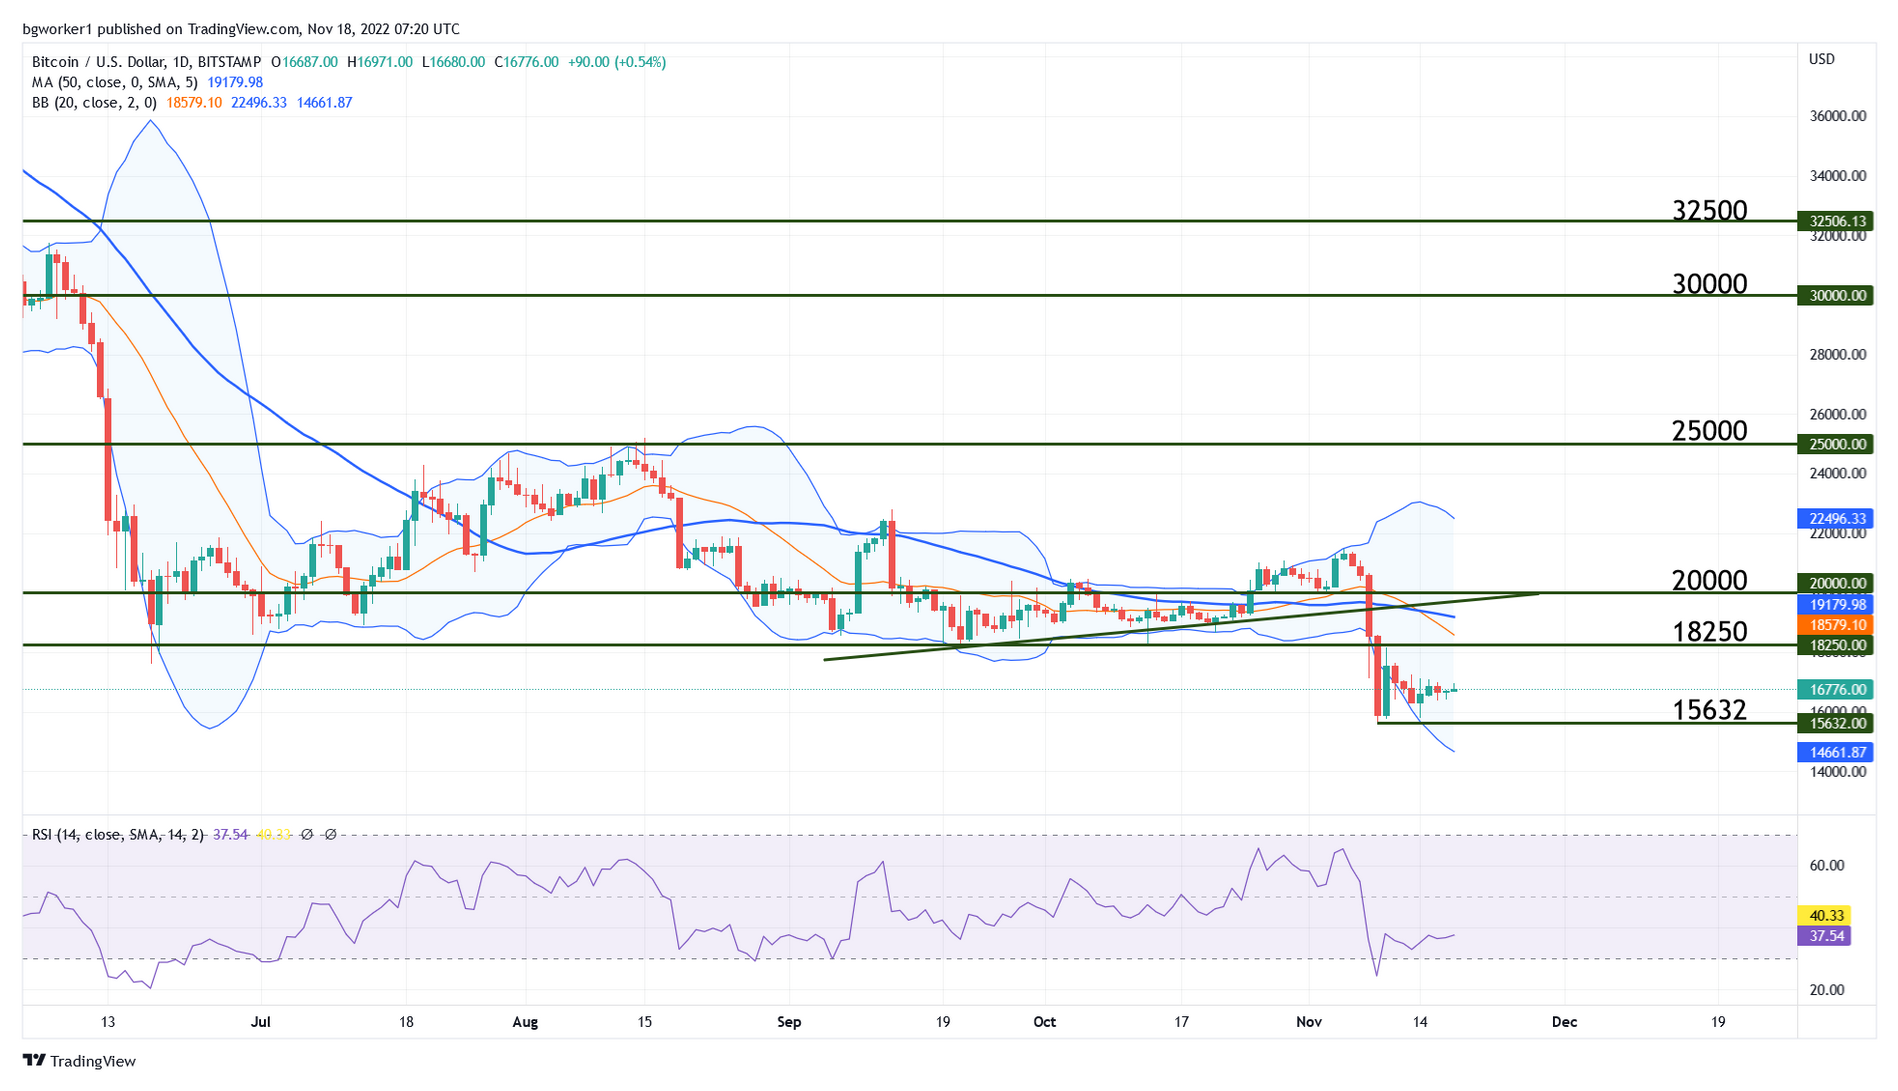
Technical Outlook – BTC/USD
Since establishing support around $18,250, Bitcoin has been trading mostly in a range and the bears weren’t able to make a new significant low. But this all changed once the FTX news hit the wire, causing Bitcoin to plummet below $16K.
Usually, when an asset spends a long time trapped inside a range, it breaks out and keeps going in the direction of the break. Unless the break is fake, in which case, the price will return inside the range.
A false break usually occurs when the volume is low and movement is slow. The current breakout shows both volume and momentum, so there’s a good chance that the break is true. However, the pair touched oversold during the initial drop, and looking at a Weekly chart, it touched oversold back in June. More than this, it is currently showing a bullish divergence on the same Weekly chart.
To sum it up, we have a bearish breakout that seems to be true but we can also see signs of exhaustion of the downtrend. This calls for caution because the bears could still make some moves but if the previous low is not broken soon, the bulls may step in.