Binance – FTX Deal Falls Through. Bitcoin Takes the Blow.
CPI Below Forecast. Is the Fed’s Plan Working?
Bitcoin traded below $16,000 for the first time since November 2020, following the demise of the FTX exchange and its native FTT token. The drop started Tuesday, November 8, after Binance announced that it will acquire FTX, to address a “liquidity crunch”.
In an interesting turn of events, the deal fell through just a day after it was announced and confirmed on Twitter by Bankman-Fried and Changpeng Zhao, the heads of the two crypto exchanges. Binance backed out of the deal, saying “In the beginning, our hope was to be able to support FTX’s customers to provide liquidity […] But the issues are beyond our control or ability to help.”
Binance’s CZ also announced that the company is selling its FTT holdings, which added more fuel to the fire and accelerated the sell-off. Part of Binance’s official statement reads: “As a result of corporate due diligence, as well as the latest news reports regarding mishandled customer funds and alleged US agency investigations, we have decided that we will not pursue the potential acquisition of FTX.com.”
After this turmoil that took BTC/USD to a low at $15,632, the US Dollar softened Thursday when the CPI was announced. The report showed that inflation in the U.S. is finally showing signs of slowing down and Fed’s Mary Daly even acknowledged that “The time is now to step down on the pace of rate hikes”.
Technical Outlook – BTC/USD
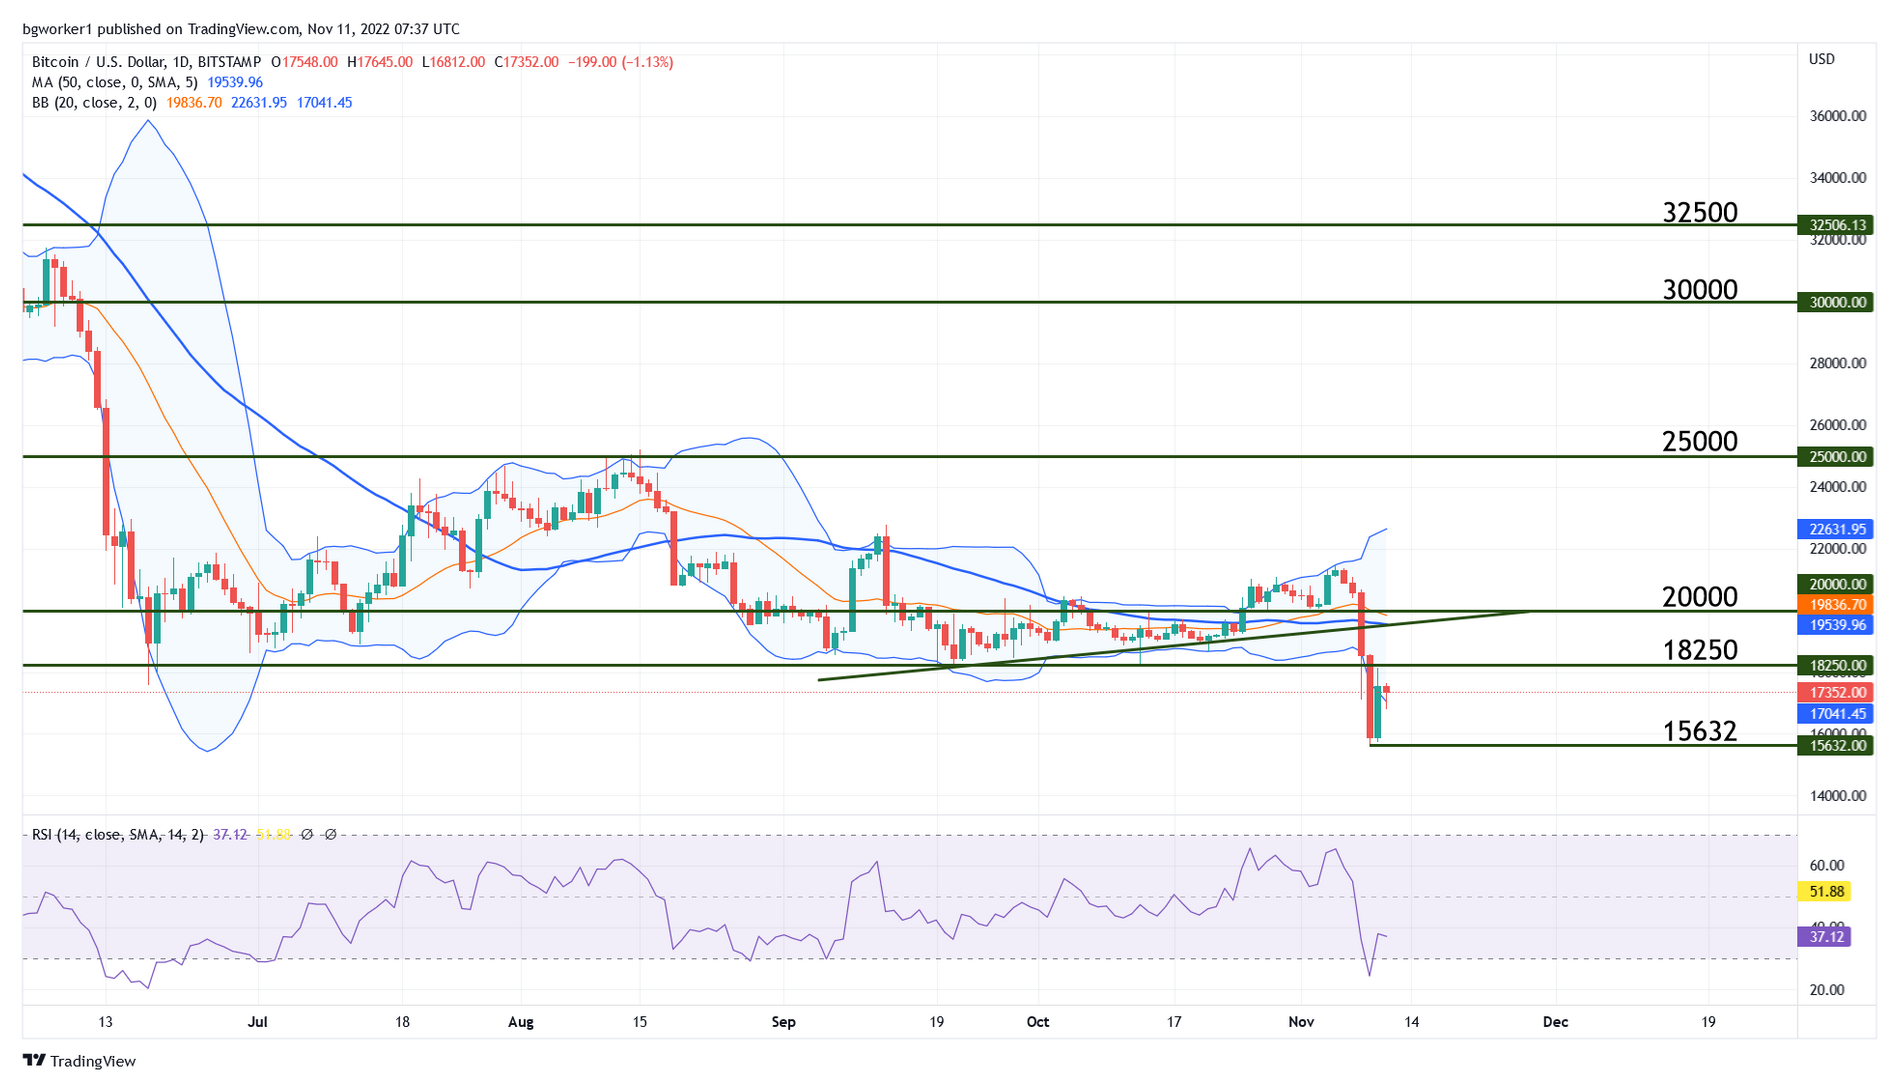
For two consecutive days, BTC sank like an axe to the bottom of a lake, reaching a low at $15,632 and breaking through several support levels. BTC/USD failed to stay above the key level at $20K and destroyed the bullish trend line as well as the previous low at $18,250.
The bullish impulse created by the CPI release failed to take the pair above $18,250, which means that the level is now resistance (the price came very close to it and bounced lower). The pair is trading on the lower Bollinger Band but the bands are expanding and moving in different directions, which is usually a sign that the move will continue.
Looking at the Weekly charts, the Relative Strength Index entered oversold territory back in June 2022 and now it is showing bullish divergence (the price has made a lower low but the RSI has not). The last time the RSI was oversold on a Weekly chart was back in November 2018. What followed was a climb from roughly $3K to just south of $14K.
The bottom line is that the long-term downtrend has just received a boost in the form of a new low. Could this be the bears’ swansong and thus the end of the said downtrend? Or is Bitcoin headed to $15K and lower?