Bitcoin Eyes Breakout as “The 12 Day War” Ends
Support in Place: Are The Bulls Getting Ready For Massive Breakout?
As the Middle East conflict cooled off, the crypto market stabilized across the board, with most of the Top 10 coins erasing a significant portion of the previous losses. The relief rally was mostly triggered by the announcement of a ceasefire between Israel and Iran after the U.S. dropped “bunker buster” bombs on three of Iran’s main uranium enrichment facilities.
U.S. President Donald Trump brokered a ceasefire agreement between Iran and Israel, which appears to be holding, or at least that’s the case at the time of writing. These new developments brought back crypto investors, as evidenced by a 12-day streak of net inflows for spot Bitcoin ETFs. During this streak, spot BTC exchange-traded funds added nearly $4 billion, according to The Block.
Leading the charge is BlackRock’s IBIT fund, followed by the ETFs of Fidelity, Ark Invest, and Bitwise. Ethereum spot ETFs also brought in inflows, although much smaller than Bitcoin ETFs; however, the discrepancy between BTC and ETH spot ETFs volume is well known, so the takeaway here is that both BTC and ETH funds are bringing in investors.
All this comes in the back of a weaker dollar, which was shaken by the feud between President Trump and Fed Chair Powell, or rather the President’s disapproval of Powell’s tactics. For some time now, Trump has been saying that the rate should be lower, while Powell is adopting a “wait and see” approach. The President is now looking to name a Fed Chair replacement by September or October, possibly looking to undermine Powell’s authority for the remainder of his mandate, which is set to end in May 2026.
Chart Analysis – BTC/USD
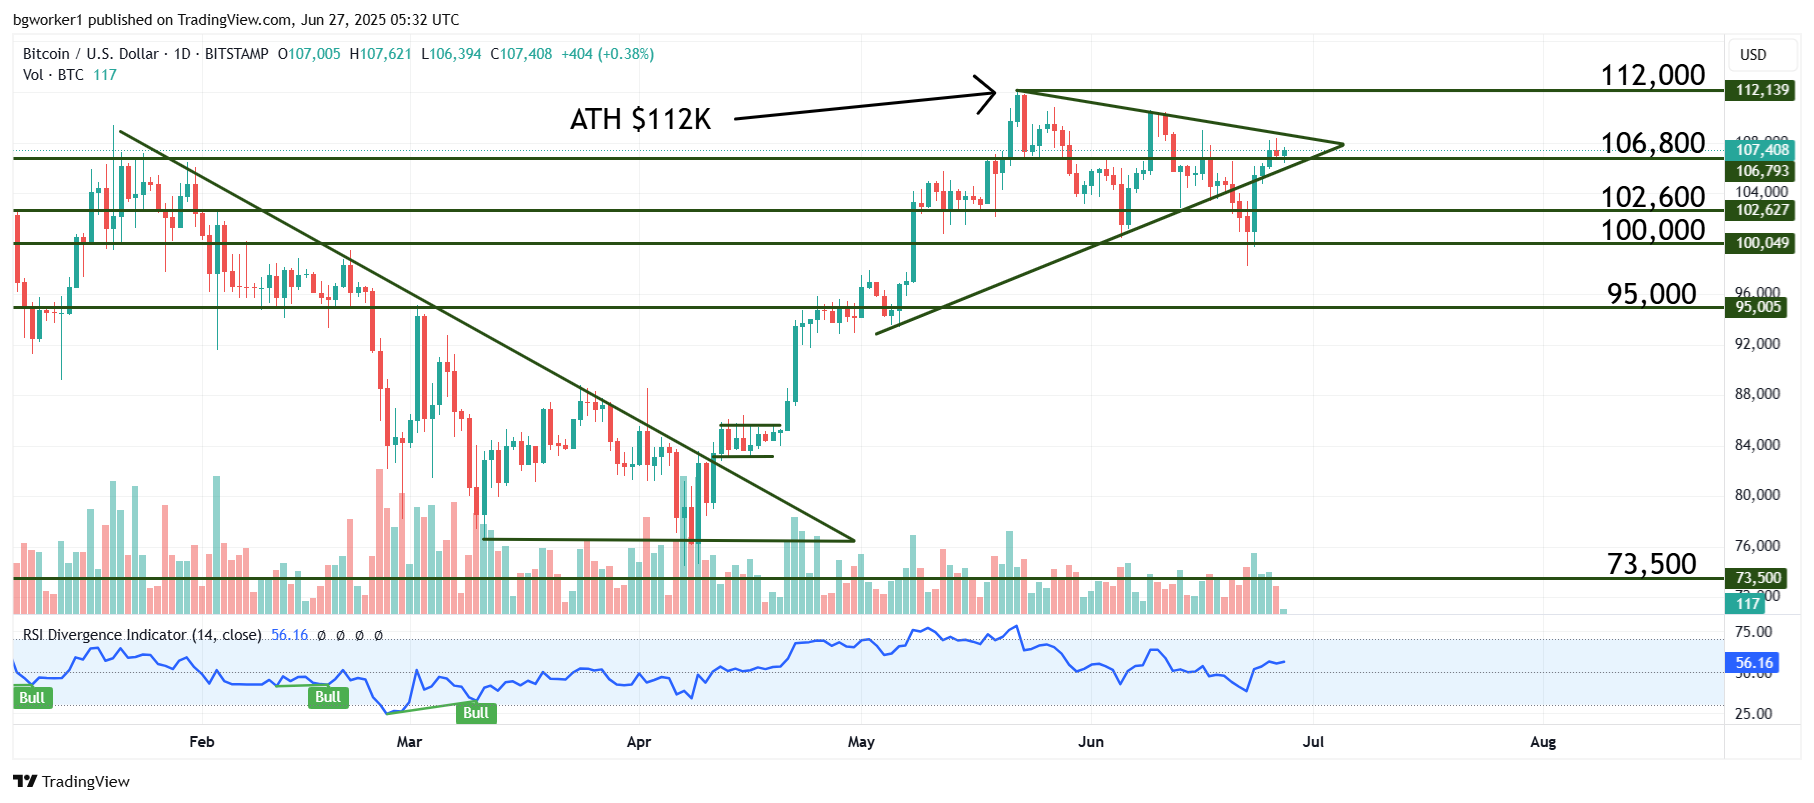
Bitcoin broke a bullish trend line last Friday and then dropped below the key support located at $100K. It was looking bleak for the OG cryptocurrency, but the de-escalation of the Middle East conflict coupled with renewed institutional interest in buying the dip, brought Bitcoin significantly higher.
BTC/USD climbed once again above the $106,800 level and is challenging the upper boundary (bearish trend line) of the symmetrical triangle, which it previously broke to the downside. If the bulls can surpass this technical barrier, there’s a high probability of a renewed uptrend and a consequent break of the previous high located at $112K.
The RSI is not even close to extreme territory and is not showing any type of divergence, so it does not provide any strong signal. For now, a daily close above or below a significant level or trend line will let us know more about the next move. Keep in mind that the fundamental scene still poses plenty of risks and can be a determining factor.