Bitcoin Holds Firm Despite Fed Delay, Middle East Tensions
Bitcoin Trapped Inside a Symmetrical Triangle. Breakout or Breakdown?
The markets had a knee-jerk reaction to the Fed’s decision to keep the interest rate unchanged, as was widely anticipated. What caught markets by surprise was the dialing back of the rate cut expectations by the Fed, mentioning increased inflation risks coming from President Trump’s tariffs and rising tensions in the Middle East.
Bitcoin initially dropped on Wednesday, reaching a low at $103,500 but soon recovered and ended the day just below $105,000. The conflict in the Middle East is weighing on risk assets such as cryptocurrencies and the prospect of the U.S. having a direct involvement is not helping at all.
Despite the armed conflict, sweeping tariffs, and delayed hopes of rate cuts, Bitcoin is holding steady, and many consider the GENIUS Act to be the reason. The Guiding and Establishing National Innovation for US Stablecoins passed the U.S. Senate with a 68 – 30 vote. The Act was introduced by Tennessee Senator Bill Hagerty who said “With this bill, the United States is one step closer to becoming the global leader in crypto”.
If payments using stablecoins become compliant with U.S. legislation, this will open the door for giants like Google, Amazon, Apple, etc. to issue their own stablecoins and to accept them as payment for their goods and services. Needless to say, this would really bring crypto into the mainstream.
Chart Analysis – BTC/USD
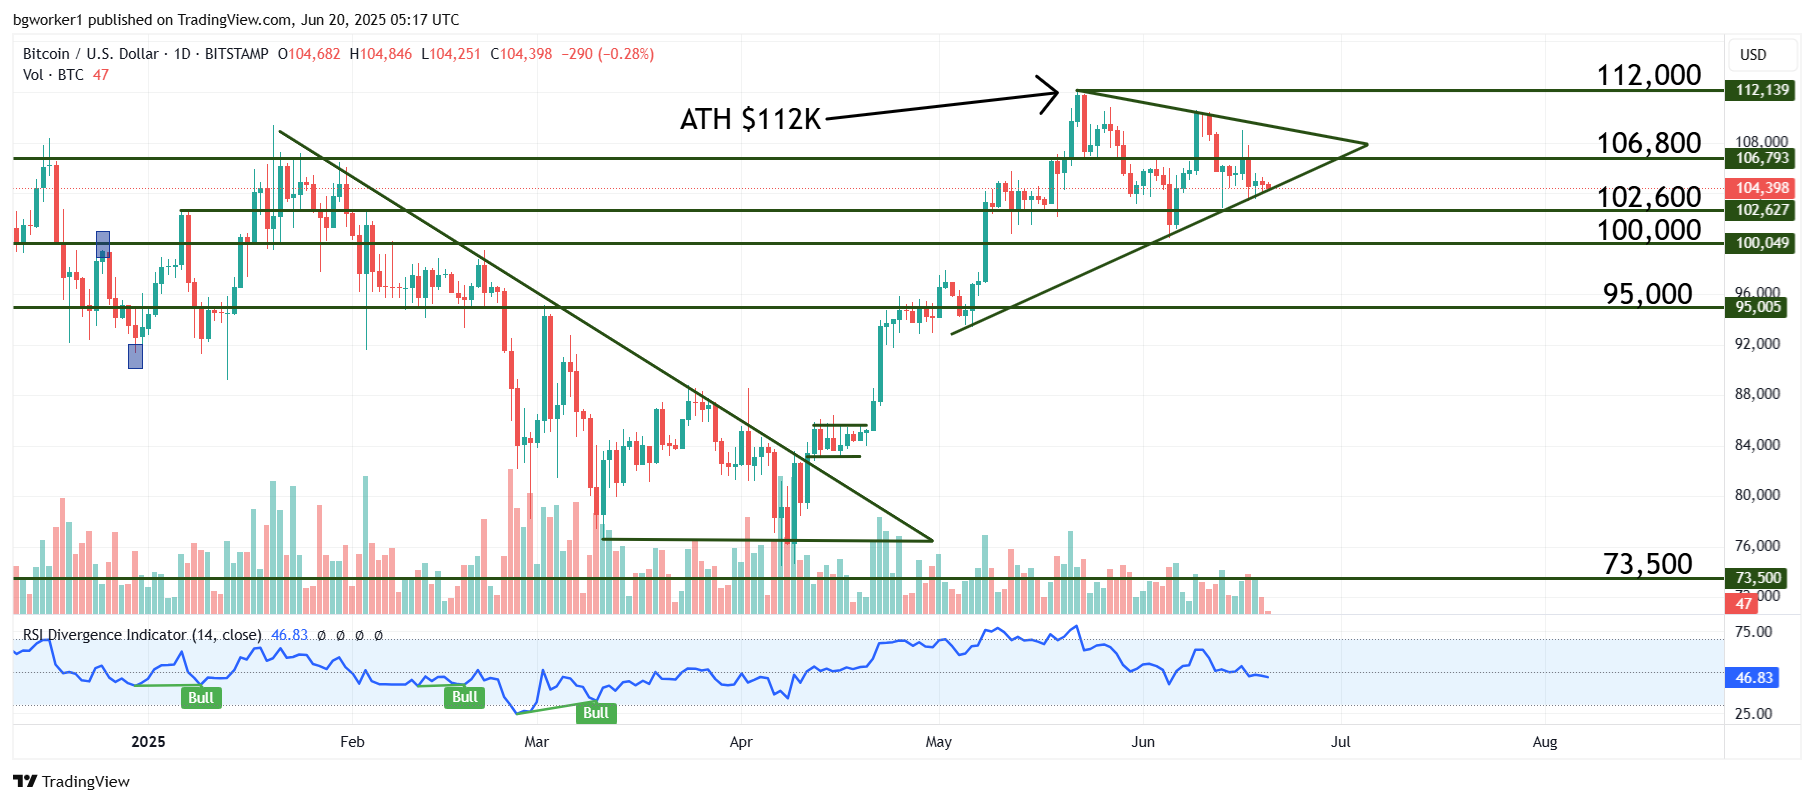
Bitcoin is trying to look for direction but the macroeconomic and geopolitical environment is deterring it from making a clear move. Since printing the latest ATH at $112K, the price started to make lower highs and higher lows, which indicates a compression stage. The prevalent chart pattern is a symmetrical triangle, which does not indicate direction so much but it warns that a breakout or breakdown will eventually occur.
Recent price action has displayed several candlesticks that indicate indecision, including Dojis—characterized by small bodies and short wicks—and pinbars, which have small bodies and very long wicks. Especially this last type of candlestick shows that there was interest from one side but the other side came back strong by the end of the session and reversed direction (or at least erased most of the gains/losses).
The next direction will be determined by the break of either side of the triangle mentioned earlier. Also important to watch out for is a break of an important level such as $106,800 as resistance or $102,600 as support. A true break can occur if a daily candle with high volume closes above or below these levels.