How to Trade Binary Options 3: Market Analysis I – Fundamental Drivers
Retail binary options tend to be short-term, which means fundamental analysis will be less about building a 1- month valuation model and more about understanding the fundamental factors that can force a price to move right now. In longer-horizon investing, it can be enough to be broadly right on inflation, growth, and earnings to make a profit, since you can wait for the market to catch up and sell when the time is right. With short-term binary options, you do not have the luxury of waiting. The contract settles when the clock says it settles, not when your macro view finally moves the price to a point where you want to exit.
High-impact economic releases matter more in binaries than many newcomers expect. A conventional trader can often absorb a violent first move, let the market settle, and manage the position through the noise. A binary trader with a one-minute, five-minute, or even hourly expiry cannot give the market time to calm down.
That does not mean every news event should or should not be traded. It only means that traders need to be aware of the fundamental factors that are likely to impact the asset price over the relevant timeframe. Many of the worst binary losses happen when traders confuse “something important is happening” with “I know how to trade this”. Sometimes the cleanest use of fundamentals is not to take a position, but to avoid being caught standing in front of a release with a short-term contract and false confidence. It is important to recognize that scheduled events can change price fast enough and violently enough to make a fixed expiry contract absurdly risky.
The practical edge, if there is one, comes less from trying to outsmart every headline and more from understanding when the market is being repriced by something real, when outside markets are confirming the move, and when execution conditions are too ugly to trust. Binary options compress timing risk so aggressively that fundamentals can easily blow a trade that felt obvious when you entered.
Here’s where you are in our 10-step guide to trading binary options:
- The Foundations of Binary Options
- Regulatory Landscape and Safety
- Market Analysis I – Fundamental Drivers
- Market Analysis II – Technical Charting
- Technical Indicators for Binary Options Trading
- The Three Pillars of Binary Options Strategy
- Timeframes & Expiry Management
- Money Management & Probability
- The Psychology of Binary Trading
- Advanced Implementation & Tax Compliance
Examples of High-Impact Economic Indicators
Below, we will take a look at central bank communication, U.S. non-farm payrolls, and the U.S. consumer price index, but exactly which economic indicators are the most relevant to your binary options strategy will largely depend on the underlying asset, even though there are also examples of macro events impacting several markets at once, or escalating step-by-step through various linked markets.
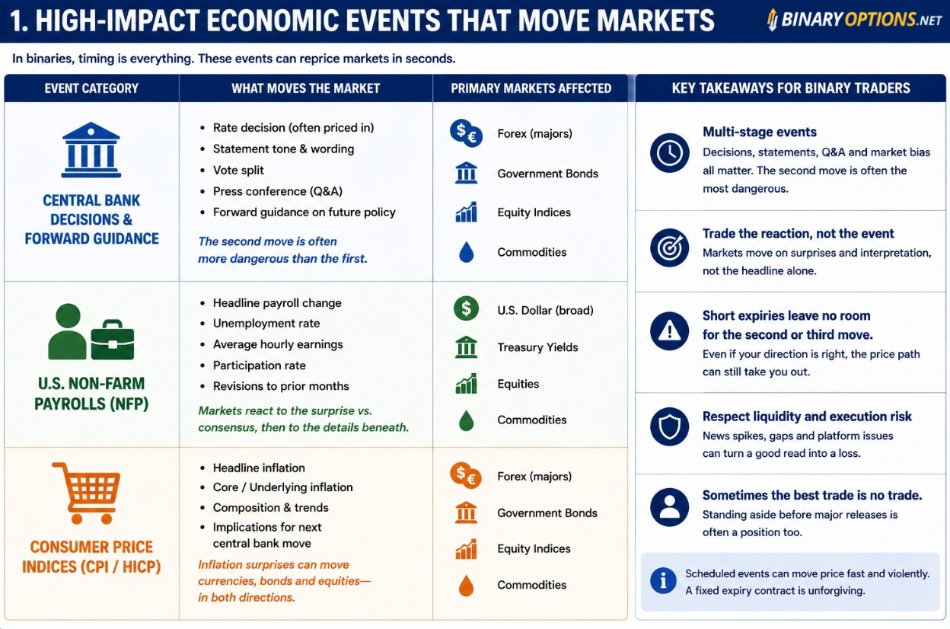
Central Bank Decisions and Forward Guidance
Central bank announcements can impact both forex and connected markets. Broadly speaking, some central banks tend to have a more far-reaching impact than others, e.g. the Federal Reserve, the European Central Bank (ECB), and the Bank of England.
Official rate decision matters, but not always in the way beginners expect, because the market can spend days or weeks pricing the most likely outcome beforehand. By decision time, the rate itself may be old news. What changes price movements as the decision being communicated is often not the rate itself, but the statement, the vote split, the tone, and the press conference.
For binary traders, this creates a timing problem. A trade entered just before the rate announcement may survive the first headline and then get ruined by the press conference. A trade entered after the first spike may still get caught by a reversal once the market has time to digest the language. In central bank events, the second move is often more dangerous than the first one because it feels more rational and therefore more tempting to chase.
The practical lesson is not that central bank events are impossible to trade.They are multi-stage events. The decision, the wording, the Q and A, and the market’s own pre-existing bias all matter. A binary trader trying to compress all that into a very short expiry is walking on thin ice.
What is Forward Guidance?
The Federal Reserve’s own explanation of forward guidance describes it as a tool central banks use to tell the public about the likely future course of monetary policy. That matters because markets trade future rates, not only current ones. A central bank can hold rates steady and still move the market sharply if its statement sounds more hawkish or dovish than expected.
Recent ECB monetary policy releases and Bank of England policy summaries show the same pattern: the headline decision is only one layer, while the policy language and outlook carry much of the repricing risk.
U.S. Non-Farm Payrolls
The United States Employment Situation report, commonly referred to in trading language as Non Farm Payrolls (NFP), remains one of the most closely watched scheduled macro releases in the world. The Bureau of Labor Statistics publishes release dates for the Employment Situation on its calendar, and in practice, the report often lands on the first Friday of the month.
The release combines establishment survey payroll data with household survey labor market information, which is why the market can react not only to the headline payroll number, but also to unemployment, participation, revisions, and wage data.
For binary traders, a main issue is velocity. NFP is one of the few releases where the first seconds after the data can reprice the US dollar sharply across major pairs. That sounds attractive to anyone trading fixed payout contracts, because sharp movement seems like an opportunity.
The problem is that conventional short term binaries are not trading “a move”. They are trading the precise position of the price at expiry. A payroll beat may strengthen the dollar at first and then reverse within minutes if wage data disappoints, prior months are revised lower, or the market decides that stronger employment raises future policy uncertainty rather than reducing it.
This is why 60-second contracts around NFP are usually closer to a coin toss than to analysis in the proper sense. The market can move in the expected direction and still settle a short expiry contract out of the money if the first spike overshoots, snaps back, or gaps around the strike. A trader may have the macro read right, and the trade still loses because the market chose a violent route to get there.
Another point gets missed often enough to be worth stating plainly. The market does not react to the payroll headline in isolation. It reacts to the difference between the actual result and the market’s consensus expectation, then re-reacts to all the details beneath it. A result close to the forecast may do very little. A large miss or beat can create the kind of sudden directional move that binary traders talk about, though the quality of that move still depends on context, positioning, and whether the market was already leaning the same way before the data hit.
Consumer Price Indices
Consumer Price Indices (CPI) matter because inflation is one of the main variables that central banks respond to, and rates drive currencies, bonds, equity valuations, and risk sentiment more broadly. For traders, it is important to know that CPI is one of the releases most likely to make a chart turn from fairly calm to something else.
Many countries release CPI information. Here are a few examples:
- United States → CPI is published by the Bureau of Labor Statistics
- United Kingdom → CPI is published by the Office for National Statistics
- European Union → Eurostat release a similar measure called HICP (Harmonised Index of Consumer Prices)
- Japan → CPI is published by the Statistics Bureau of Japan
- Canada → CPI is published by Statistics Canada
For binary traders, CPI works through expectations. The market is not shocked merely because inflation exists. The market is shocked when inflation comes in materially hotter or cooler than expected, or when the composition of the data changes assumptions about the next central bank move. A high CPI print can strengthen a currency if traders read it as increasing the chance of tighter monetary policy. It can also weaken risk assets if markets decide sticky inflation keeps rates restrictive for longer. The same data can therefore hit multiple instruments at once.
This all matters when choosing binaries on indices, currencies, or commodities. A trader taking a five-minute EUR/USD contract around US CPI needs to be aware of and manage rate expectations, US bond reactions, broad dollar repricing, and the market’s view of whether the release changes the next Fed decision. That is quite a lot to squeeze into a tiny expiry window.
CPI also shows why traders should avoid simplistic rules such as “high inflation equals stronger currency”. Sometimes it does. Sometimes it does for about thirty seconds, and then it does not. Sometimes the market had already priced it, and the real move comes from a smaller line item or a revision. Binary options punish rigid formula thinking because the instrument requires a result at a fixed time.
Examples of Notable CPI:s and Similar Indices
United States
The U.S. CPI is published by the Bureau of Labor Statistics. In the United States, the BLS describes the U.S. CPI as a measure of the average change over time in the prices paid by urban consumers for a market basket of consumer goods and services. At the BLS site, indices are available for the U.S. as a whole and for various geographic areas.
The National CPI measures inflation across the entire United States and is very important for markets and Federal Reserve policy. The Bureau of Labor Statistics also publishes CPI data for cities, metropolitan areas, and four regions (Northeast, South, Midwest, West). These CPIs help show local inflation differences, but are less important for binary option traders unless you are doing something very niche.
United Kingdom
In the UK, the Office for National Statistics (ONS) actually reports multiple inflation measures, including the CPI (the main headline figure) and the CPIH. The CPIH includes housing costs and is often preferred by economists analyzing UK inflation.
Both ONS announcements are watched closely by the Bank of England, who include them when making interest rate decisions. The official inflation target is based on CPI, so CPI remains the primary policy anchor, but CPIH is still important as a cross-check, especially when housing-driven inflation dynamics are changing.
CPI and CPIH releases are especially likely to move forex pairs that include the GBP, UK government bond yields, and FTSE stock indices. A stronger-than-expected inflation reading tends to push expectations toward tighter monetary policy, which can support GBP and lift yields, while a weaker reading tends to have the opposite effect. CPI usually drives the immediate reaction, while CPIH is often more influential in shaping the broader interpretation of inflation trends over time.
European Union
Eurostat releases a measure called HICP (Harmonised Index of Consumer Prices). It is designed to make it possible to compare inflation consistently across countries in Europe. Around the world, each country measures and calculates inflation in its own way, but within the EU, a standardized method is used for all the member countries to ensure the numbers are comparable.
The HICP framework has two layers of data, and both matter, but they are used for different purposes. The Eurozone HICP is a single aggregated inflation number for the entire Eurozone, while the country-level HICPs are published for each individual EU member state. The Eurozone HICP is only based on EU countries that have the Euro as their official currency. This means that countries such as Sweden, Denmark, Poland, Hungary, and the Czech Republic are not included.
The Eurozone HICP is especially important for the European Central Bank (ECB), which uses it when setting interest rates. When Eurozone HICP is higher than expected, markets tend to price in tighter monetary policy, which can support the euro and push bond yields higher. When it is lower than expected, it usually signals weaker inflation pressure and increases expectations for rate cuts or prolonged easing, which can weigh on the euro.
The national HICPs are used for national analysis, to compare differences in inflation, and to forecast the Eurozone HICP. National HICPs are published for all EU members, even the ones that have not adopted the Euro.
Japan
The Statistics Bureau of Japan publishes Headline CPI, Core CPI (which excludes fresh food) and Core-Core CPI (which excludes food and energy). All are important inflation indicators for financial markets, and they can move currencies, bonds, and equities.
Japan’s various CPIs can directly affect expectations around the Bank of Japan (BoJ) policy. With a higher-than-expected CPI, traders may anticipate tighter monetary policy (rate hikes and/or less stimulus), and the JPY tends to strengthen on this news. A lower-than-expected CPI typically weakens the JPY. Since Japan has been an outlier with its ultra-loose policy, even small changes in inflation can trigger outsized moves in JPY and global risk sentiment.
Japan has historically had ultra-low or negative interest rates, and a meaningful rise in CPI can shift expectations toward ending yield curve control (YCC) and raising rates, which would impact bond yields (JGBs) and carry trades for JPY-funded positions. JPY is widely used in carry trades, and JPY-funded carry trading usually expands with a falling CPI.
Japan’s CPI can also impact Japanese stock indices such as the Nikkei 225. A stronger JPY tend to hurt exporters. As always, traders don’t just care about the CPI; they also react to actual vs forecast.
Canada
Canada’s CPI is released by Statistics Canada, and it’s a key macro event for FX, rates, and equities.
This CPI is one of the main drivers of expectations for the Bank of Canada, and inflation above expectations (“hot CPI”) results in markets expecting tighter monetary policy (rate hikes or delayed cuts). Typically, this results in the CAD strengthening. If the CPI is below expectations (“soft CPI”), the market expects rate cuts sooner/more aggressive easing, and the CAD usually weakens. The most CPI-affected pairs are normally USD/CAD, CAD/JPY, and EUR/CAD.
Canada is particularly rate-sensitive due to housing debt levels. An increasing CPI is expected to be followed by higher mortgage rates, which means there is now a housing slowdown risk. This makes CPI more impactful in Canada than in many other developed economies.
While the headline CPI denotes the total inflation number and real cost of living change, Statistics Canada also publishes the Core CPI and the Mean CPI.
A problem with the headline CPI is that it tends to be very volatile, especially when gas prices swing with changes in oil prices, and food prices swing due to weather/supply shocks. The Core CPI excludes food and energy, and will therefore react less to global commodity shocks. Notably, it still includes mortgage rate interest costs and seasonal goods/services that are not food or energy.
The Mean CPI is heavily used by the Bank of Canada. It looks at all price changes in the CPI basket and finds the middle price change, where half of the items are above and half below. This method reduces the impact of extreme outliers.
There is also the Trimmed Mean CPI, which removes the top and bottom of ~20% of weights, and then calculates the average of the rest. It filters out temporary shocks (oil spikes, supply disruptions) and is better at capturing broad inflation pressure.
Global Correlation Analysis
Markets do not trade in isolation. Example: A currency pair often reflects interest rates, commodity exposure, trade balances, capital flows, and global sentiment all at once. For binary traders, correlations can be useful as lead indicators, though they should be treated as tendencies rather than laws.
The sensible use of correlation is as a filter. If a trader wants to buy a short-expiry binary on a stock index, but bond yields, volatility measures, and haven assets are all moving the wrong way, the trade idea may be weaker than the chart alone suggests. Correlations do not tell you what must happen, but can help you see whether the rest of the market is nodding along or pulling a face.
Commodity Currencies
The currencies we call “commodity currencies” are currencies of countries whose economies depend heavily on exporting raw materials like oil, metals, and agricultural products. Their value often moves with the relevant global commodity prices. There is no strict definition of exactly how commodity-driven a currency must be to be considered a commodity currency, but widely recognized examples include AUD, CAD, NZD, NOK, and ZAR.
Australia remains one of the world’s leading gold producers. Geoscience Australia lists the country among the largest global producers of gold, and gold is one of the outside markets traders watch when trying to predict AUD behaviour. That does not mean AUD and gold move together tick-for-tick, only that traders often treat rising gold prices as a supportive background for the Australian dollar, especially when broader risk sentiment is not fighting the move at the same time.
This is where binary traders need some restraint. Correlation is not causation, and even stable macro relationships can break for weeks at a time. Gold may rise because real yields fall, because geopolitical demand increases, or because the dollar weakens broadly. AUD may respond differently depending on Chinese growth expectations, Reserve Bank pricing, or risk appetite in equities. So the relationship is useful as a confirming factor, not as a one-line trade trigger.
The Canadian dollar and crude oil are a cleaner example at the structural level. Canada is a major crude producer, and the Canada Energy Regulator reports large crude export volumes from Canada. Because of that export link, oil price moves can act as a tailwind or headwind for CAD, particularly against the US dollar. When oil spikes due to supply concerns or geopolitical stress, CAD often strengthens, though again not perfectly or instantly in every market condition.
For a binary trader, the value of this relationship is practical. If WTI breaks sharply higher on a credible supply shock, it can herald increased demand for Western Canada Select (WCS), and that move can provide useful context before taking a USD/CAD binary. It does not guarantee direction, but it helps answer whether the currency move has an external driver behind it or is just a short-term wobble in the pair itself.
The New Zealand dollar (NZD) is driven by agricultural exports, including dairy and meat. It is very sensitive to relevant global food prices and risk sentiment. If global dairy prices go up, the NZD normally strengthens, with the main pairs affected being NZD/USD and NZD/JPY.
The Norwegian krone (NOK) is heavily tied to oil and natural gas exports. While the CAD is chiefly driven by North American crude (WTI) price and Canadian oil exports, the NOK is tied more to Brent pricing. The most affected pairs are usually the EUR/NOK and the USD/NOK.
The South African Rand (ZAR) is linked to the price of several metals, including gold and platinum. It is also sensitive to global risk sentiment. When there is general market fear, the ZAR usually weakens, with an especially notable impact on the USD/ZAR pair. When there is an increase (or expected increase) in the price of gold and/or platinum group metals (PGMs), we typically see the ZAR strengthen.
Risk On and Risk Off Flows
As we have already briefly touched on above, many currencies are moved by “risk on” versus “risk off” market behavior.
- A risk-on environment is when investors are optimistic about economic growth, corporate earnings, and market stability. They believe central banks will maintain liquidity and low rates. In these conditions, investors flock to higher-risk, higher-return assets.
- A risk-off environment is when investors are worried about a lack of or no economic growth, financial instability, geopolitical shocks, and tight monetary policy. They move their money to safer and more defensive assets, including currencies that are considered safer.
In periods of calm growth optimism, markets often favor higher beta currencies and cyclical assets. Higher beta currencies are currencies that tend to move more aggressively than global benchmarks when market sentiment shifts, and examples of such currencies are the AUD, NZD, MXN, ZAR, CLP, and NOK.
In periods of stress, money tends to move toward safer or more liquid havens, and this is one reason why traders analyze the JPY and CHF in conjunction with gold prices, government bond yields, and equity index futures to paint a fuller picture.
For binary traders, this framework matters because it explains how a clean technical chart can suddenly become less dependable. A currency pair can look stable until equity futures roll over, the VIX jumps, and broad risk sentiment turns defensive. At that point, old intraday levels may matter less than the sudden need for the market to cut exposure.
In risk-off phases, gold often benefits, the Japanese yen and Swiss franc can strengthen, and equity indices tend to become more fragile. In risk-on phases, those flows can reverse, while currencies tied more closely to growth or yield demand may perform better.
The problem for binaries is that this shift can happen fast, sometimes triggered by a single headline, and the trader is left sitting with fixed-time contracts that can not be adjusted and will not fare well in this new environment.
Using the Economic Calendar
A binary trader should treat the economic calendar as a risk map first and an opportunity map second. This is where many retail traders get the order wrong. They open the calendar looking for excitement when they should be looking for landmines.
Popular economic calendars such as Trading Economics organise releases by time, impact level, and fields such as actual, forecast, and previous. That structure is useful because it helps separate ordinary background data from events likely to move the price in a way that matters for a short expiry contract.
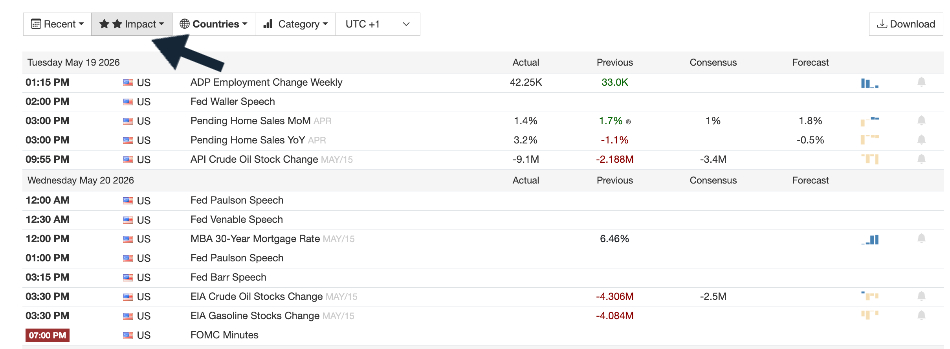
Trading Economics calendar set to US markets and high-impact events
Impact
The first filter is impact. Not every release deserves the same respect. In practice, traders often focus most closely on the highest impact events because those are the ones most likely to create fast repricing. For binary traders, that does not automatically mean they should trade them. Often it means the opposite. Many short-term traders prefer to avoid the 15 minutes before and after a top-tier release because the first moves can be disorderly, and strikes can become less attractive, and the platform itself may struggle.
Avoiding chaos is also a trading decision, even if it feels like being passive. In practical terms, the calendar is doing at least three jobs at once. It tells you when to stay out, when to reduce trust in short expiries, and when a move on one chart may soon spill into several others. Used properly, it is less of a trading signal generator and more of a don’t trade signal generator.
Deviation From Consensus
The second filter is deviation from consensus. Markets respond to surprise, not just data. A payroll print near forecast may create only a modest reaction. A large miss or beat is more likely to produce the kind of sudden volatility that binary traders either seek or should fear, depending on their setup. The same principle applies to CPI, GDP, retail sales, and central bank decisions.
What matters is not the raw number in isolation, but the distance between reality and what had been priced in. This sounds simple, but it is where sloppy interpretation starts. A trader sees “actual better than forecast” and assumes the currency must rally. Real markets are less obedient. Sometimes the better number is already priced. Sometimes another part of the release matters more. Sometimes the market had been positioned heavily in one direction and uses even good news as an excuse to take profit and reverse. Binary traders need to respect that the market is pricing expectations, not handing out points for answering a quiz correctly.
Timing
Timing on the calendar also matters across regions. A trader working global markets needs to know not just what is being released, but which session is active when it is released. US labor data hitting during the London-New York overlap is a different event from a second-tier release landing in a thin holiday session. Liquidity conditions shape how the move behaves, and binaries are unusually sensitive to that behavior because of their fixed expiry.
The London – New York overlap has the highest liquidity for forex, and also for certain equities and quite a lot of energy commodities. Super high liquidity means really deep order books, faster price discovery, and often also cleaner trends after news.
When liquidity is lower, we see thinner order books, which result in more erratic spikes around news. Traders using technical analysis should expect more false breakouts. There can be sharp spikes and sharp reversals. Liquidity can be especially low during holidays, and news can distort prices disproportionately. Unscheduled global macro events happen even during holidays, and they can quickly result in strong volatility, unreliable price behavior, and exaggerated moves with no follow-through.
Binary options are especially sensitive since the fixed expiry time removes flexibility. You cannot decide to hold them through noise. This means that, generally speaking, binary options trading should be avoided during low liquidity, especially if combined with news.
Market Sentiment: The Crowd Factor
Fundamentals and correlations explain a lot, but not everything. Markets are social systems, which means sentiment matters even when the underlying data has not changed much. A market can remain bullish on bad data, bearish on decent data, or exhausted after a move that looked justified on paper. Binary traders need to care because sentiment often shapes the path price takes into expiry.
The Cboe Volatility Index® (VIX Index) is one of the most common sentiment gauges in the broader market. This index is based on real-time prices of options on the S&P 500 Index (SPX) and is designed to reflect investors’ consensus view of future (30-day) expected stock market volatility. The VIX Index is often referred to as the market’s “fear gauge”. That nickname is useful so long as it is not treated too literally. A high VIX does not mean prices must fall that second. It means expected volatility is elevated, which often coincides with uncertainty, unstable equity sentiment, and less orderly price action.
For binary traders, a rising VIX or similar volatility signal should be read as a warning that short-term contracts may become even harder to price cleanly. Higher volatility can produce attractive directional bursts, but it can also widen the gap between a good market read and a good binary result. When volatility climbs, the market can hit your thesis and still take the scenic route, missing your expiry.
Retail sentiment tools are another part of the crowd factor. Some binary trading platforms display some version of “traders’ choice” or a percentage split showing how their users are positioned. These tools look informative, though they need handling with care. They do not show the whole market. They show one slice of one platform’s users, often the least informed slice of the overall flow. That is why many experienced traders treat such data as a soft contrarian signal rather than as confirmation. If an overwhelming majority of retail users are already leaning one way, the trade may be crowded and easier to squeeze.
With that said, crowding is not a mechanical reversal signal. A market can remain crowded for a long time if the dominant macro driver is strong enough. Retail sentiment is best used as context. If a pair is already stretched, a major release is approaching, and platform sentiment shows an extreme one-sided bias, the odds of messy price action are probably higher. In binaries, messy price action is not just annoying; it is often fatal to the contract.
News Trading & Execution Risk
Even if your analysis is sound, news trading in binary options carries execution risk that can ruin the trade. News trading in binaries is never just about being right; it is about being right, at exactly the right expiry time, on a properly functioning trading platform, and under conditions where the contract can still be entered and settled fairly. That is a lot of conditions for a product that likes to advertise itself as simple and suitable for inexperienced traders.
Price Gaps and Jumpy Ticks
The first issue is price gaps and jumpy ticks. During a major release, the price may skip levels rather than trade smoothly through them. A trader can end up with an entry or strike that looks much worse than expected, or can watch the market jump over a level entirely.
In a spot trade, that is frustrating. In a binary, where expiry and payout are fixed, it can turn a correct directional idea into an out-of-the-money loss.
Effective Spread or Strike Deterioration
Another issue is effective strike deterioration. A platform may widen the practical gap between what a call and put trader is being offered during volatile conditions. That makes the entry less attractive right when the chart looks most exciting. In other words, the market serves drama, and the platform raises the cover charge.
You can reduce this problem by changing the instrument instead of trying to “out-trade” the execution issue for binary options. In markets like spot FX, futures, or listed options, you would not be locked into a fixed win/lose outcome at one specific second in time. Instead of needing the price to be right at a certain second, you can enter, manage, or exit a position as liquidity returns after the initial spike. This flexibility matters because most of the “edge” around news doesn’t exist at one clean price point; it evolves over seconds or minutes as order books refill.
By staying away from binaries during unsuitable conditions, traders can pick instruments where it is possible to manage risk by scaling position size, placing stop-loss orders, and making partial exits. If the initial news spike is messy or slippage occurs, the result will not hinge on a predetermined second in time.
It is also a good idea to stick to platforms where pricing is transparent and continuous. In futures markets such as crude oil or equity index futures, or in regulated FX markets, price discovery is driven by competing participants rather than a single platform setting payout conditions. That reduces the risk of hidden adjustments like payout drops or strike shifts. If spreads widen during volatility, it is visible and measurable rather than embedded inside the contract structure.
There is also a timing element. Many experienced traders simply refrain from trading for a short while right after a major release. They wait for the initial volatility burst to pass and trade when liquidity returns and price movements become more predictable. What they are trading is not the immediate reaction, but the second move, i.e. the more sustained repricing once the market has digested the data.
Platform Lag and Deliberate Manipulation
There is also the risk of platform lag and deliberate manipulation to consider. Around top-tier releases, some OTC platforms freeze, delay order acceptance, reject entries, or struggle to update price feeds smoothly. Fast market performance can deteriorate when too many users pile in at once.
It is also well-known that some brokers tamper with the platform and price feed deliberately in hectic situations, causing harm to traders to protect their own bottom line. And when markets are storming, actually proving any wrongdoing will be exceedingly difficult, unless the broker is supervised and audited by a strict financial authority that can access and assess every little detail. Regulators such as the CFTC have warned repeatedly that fraudulent binary platforms based in lax jurisdictions are manipulating software and engaging in other abusive practices.