Thin Markets, Big Wicks: Bitcoin’s Holiday Warning
BTC/USD1 Recovers From $24K on Binance. New Stablecoins and Their Risks
Navigating end-of-year volatility can be tough because liquidity conditions can change in an instant, and thin order books can allow flash moves to happen. And this was just the case on Christmas Eve, December 24, when Bitcoin briefly crashed to $24,111 against the stablecoin USD1 on Binance.
The move was only visible on BTC/USD1 charts and did not show up on any other Bitcoin charts. The pair snapped back up above $87K immediately after the drop, leaving behind a huge wick, and probably taking out quite a few stop-loss orders.
This was not a case of the overall market collapsing, but rather a liquidity issue isolated to USD1. In times when the order books are shallow, which usually happens during holidays, a sudden move can be amplified. Trading bots can react to the sudden price change, and because there aren’t a lot of orders to absorb the flow, the crash becomes bigger.
These flash moves are treated like isolated events and do not affect how market participants see the overall direction of an asset. However, when such moves occur, it’s a stark reminder of the dangers of trading in thin liquidity or trading coins that are not yet fully established.
New Player: USD1
USD1 is a new stablecoin issued by the Trump family through the World Liberty Financial project, and it started trading on Binance just this month, on December 4. With a $2.7 billion market cap, USD1 is fully backed by U.S Treasury bills and pegged 1:1 to the US Dollar.
Its listing on Binance follows Changpeng (CZ) Zhao’s pardon issued by President Trump in October. CZ is the founder of Binance and was its CEO until pleading guilty to violating the Bank Secrecy Act back in November 2023. The pardon came under heavy scrutiny, with some voices claiming that the influence of money played an important role.
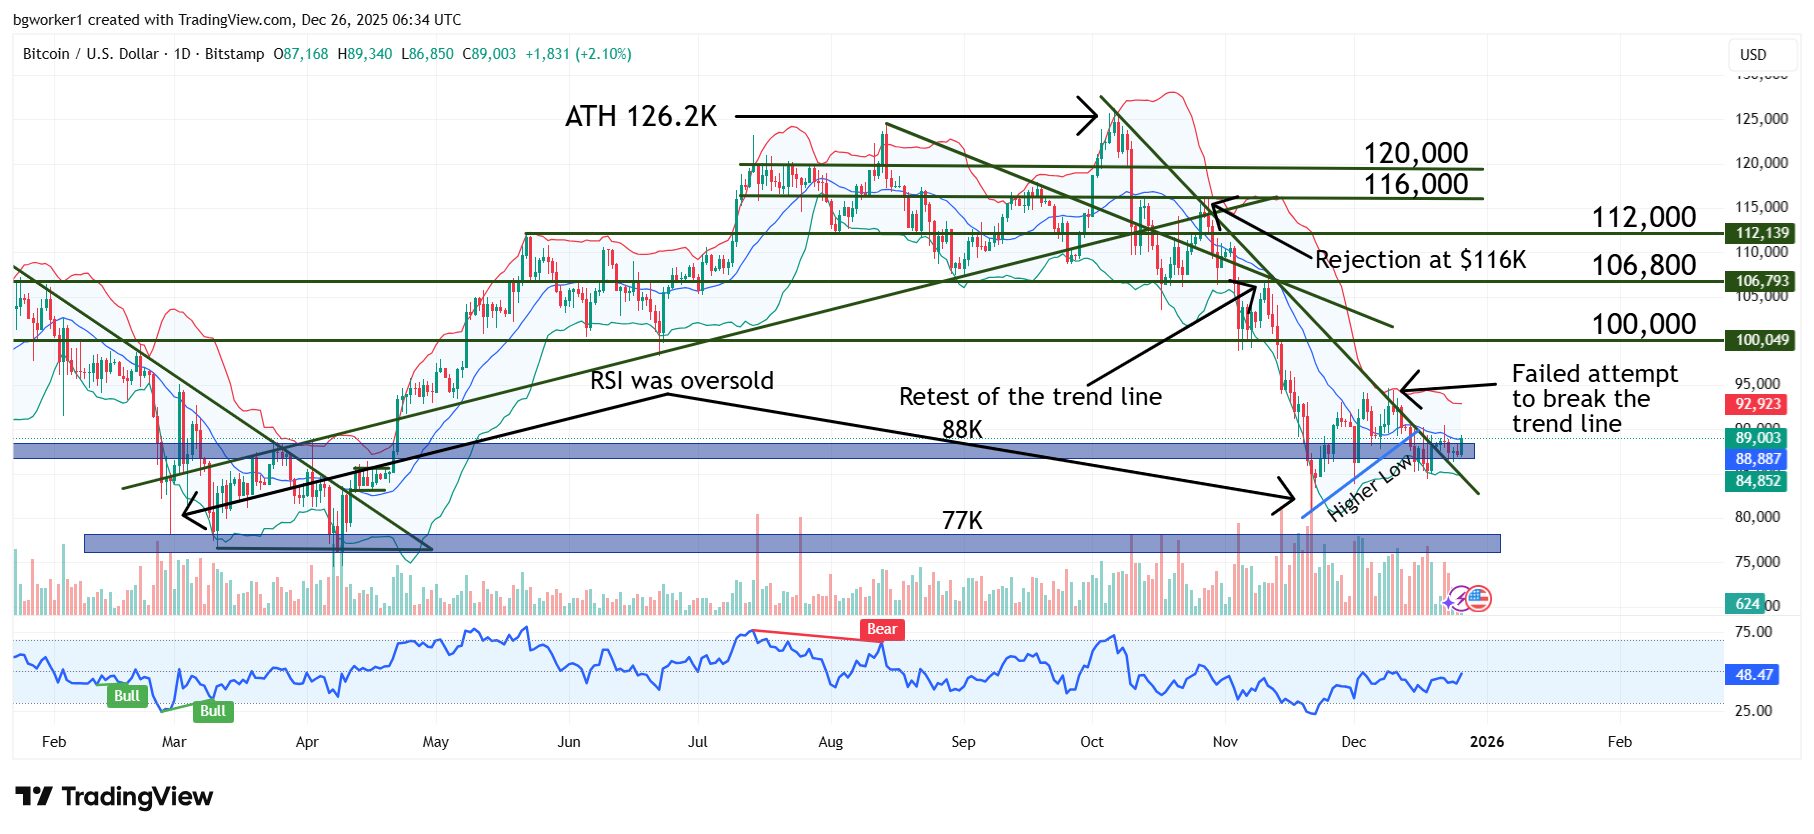
Chart Analysis – BTC/USD
Bitcoin broke above the long-term bearish trend line drawn from the All-Time High (ATH), but we cannot call the move a breakout. The price is simply moving sideways, flat, and without any bullish momentum. So, the ‘breakout’ happened just because enough time passed for the price to move further to the right and to exit the trend line.
This does not mean that a bullish move cannot happen soon, and in fact, the current move starts to resemble the previous breakout more and more. After the RSI entered oversold the last time (February 2025), the price traded sideways for a while and then exited a trend line. After that breakout, it moved flat in a very tight range before exploding to a new historic high. Time will tell if this will happen again. In the meantime, be wary of weird moves generated by end-of-year volatility.