Low U.S Inflation: The Spark Behind End-of-Year BTC Rally?
Can History Repeat Itself? The RSI and a Trend Line May Have the Answer
The surprise of the week came from the U.S. year-over-year CPI, which posted a reading of 2.7%, way below the consensus 3.1%. The Core version posted a similar reading, of 2.6%, lower than the forecast 3.0%.
This is especially important now because Bitcoin and the crypto market in general experienced a sell-off when the chances of another swift cut dropped after the December Fed meeting. Lower inflation would justify another cut soon, considering the Fed’s dual mandate to keep inflation low and job creation high.
And since inflation is inching closer to the target 2.0%, while the job market is not doing so well, a rate cut would be justified, or at least more probable. Earlier in the week, the Non-Farm Payrolls report showed that 64K new jobs were created, which was higher than the anticipated 51K. However, the Average Hourly Earnings showed a change of 0.1%, lower than the previous 0.4% and the forecast 0.3%. On top of that, the Unemployment Rate jumped to 4.6% from the previous 4.4%, so it’s safe to say that the U.S. labor market could use a nudge in the right direction.
Crypto ETFs Start Moving Again
Meanwhile, in the spot Bitcoin ETF space, things are looking up, but not by much. On Wednesday, the ETFs saw overall inflows of more than $457 million; this followed two days of outflows ($277 million and $357 million, respectively). This is the largest inflow volume since November 11, when the ETFs saw $524 million in inflows, according to data from Coinglass.
The star of the spot crypto ETF space is Ripple, as XRP ETFs saw inflows every day since their inception, according to the same source. Not a single red day. However, the XRP charts keep sliding lower, and XRP doesn’t seem to enjoy the same tailwinds from ETFs as Bitcoin did when they were first launched.
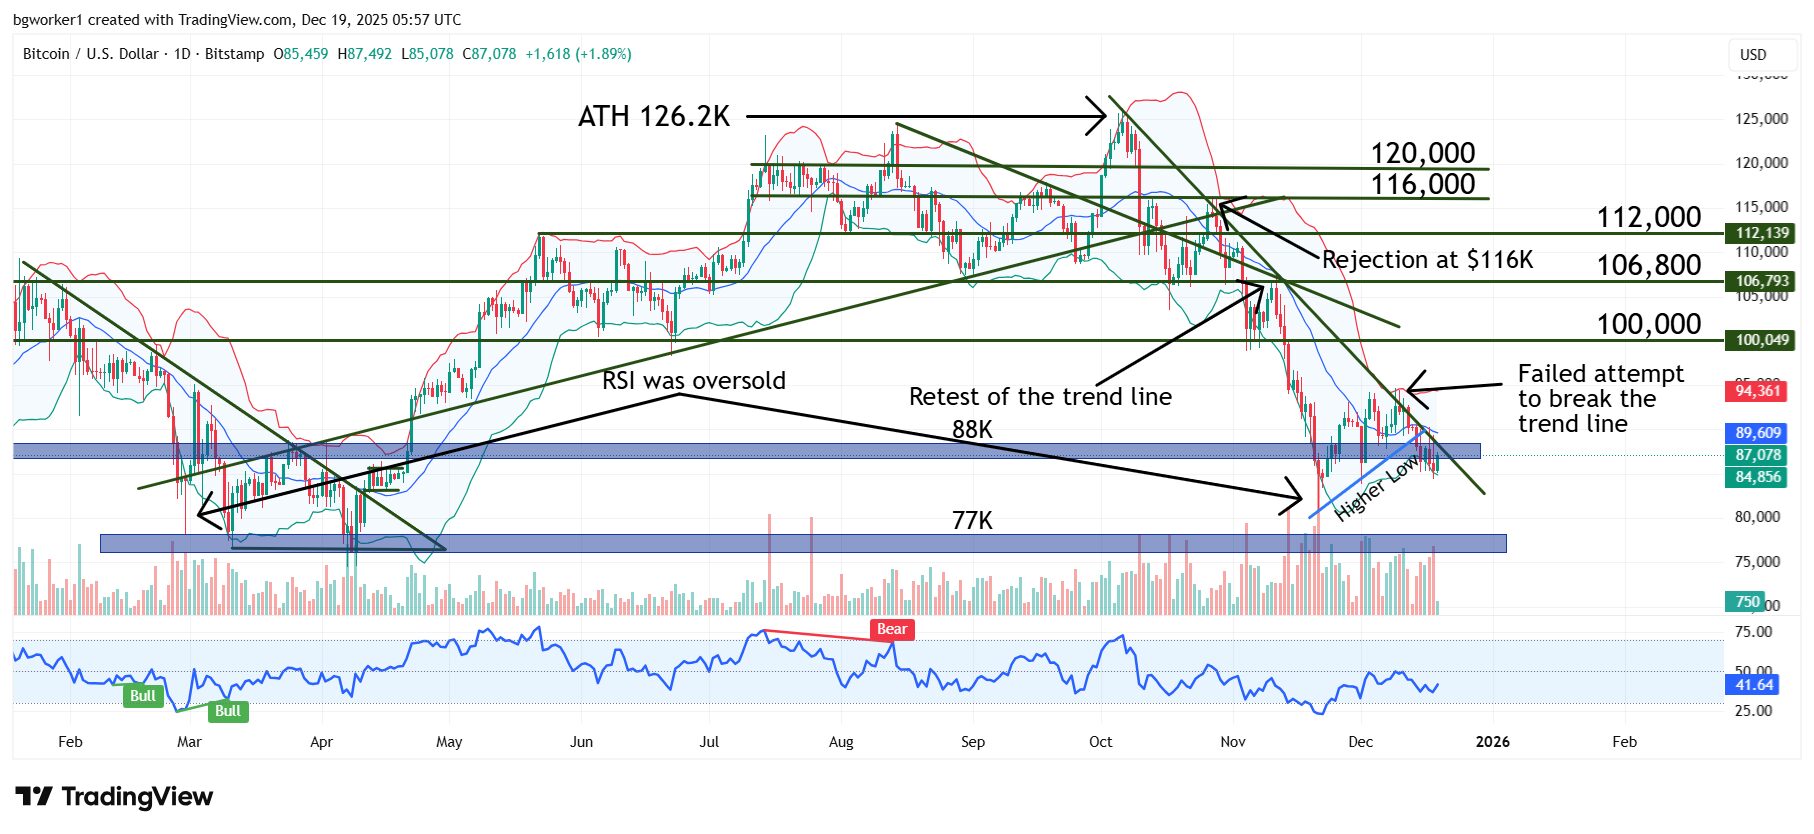
Chart Analysis – BTC/USD
On December 14, Bitcoin broke below the fragile bullish trend line, but it recovered and is now challenging the long-term bearish trend line drawn from the All-Time High (ATH). We still have three higher lows, which is a bullish sign, but it has to be accompanied by others for a substantial rally to happen.
Another bullish sign may come from the behavior of the price the last time the RSI was oversold, back in February 2025. After the initial break of the 30 level of the RSI, the price continued to drift lower for a while before breaking the trend line and erupting to what was an ATH at the time.
Recently, the RSI broke below its 30 level again, and now the price is showing a similar behavior, but maybe more bullish because it’s printing higher lows, not lower lows. In February, the trigger for the massive rally was the break of a similar bearish trend line. Will history repeat itself? Nobody knows.