What Is Support And What Are Support Lines?
In a previous posting I began a series on support and resistance. In that article I laid out two basic rules for support and resistance lines that all traders should follow. These are 1) S/R lines are not a signal, they are places where signals are likely to happen. If this sounds familiar you are right, support and resistance lines are much like Fibonacci Retracements in that regard. The second rule of mine is that in order to trade a support or resistance line you must wait for a confirmation. Of course, neither of these rules really address how and where to draw these lines and more importantly, why they are important. That is what I am going to try and explain today. One thing to keep in mind is that there are a variety of places and methods to draw support and resistance, the key is in knowing which ones are more important and just how to interpret what it means.
Support, or support levels, are areas where the market is likely to buy an asset. In the market these are price levels where stocks, commodities, currencies or other assets are attractive buys and the market is accumulating them. This could be because prices have retraced a certain amount from a peak, the stock is expected to split, or produce higher than expected earnings, or has a prime product in the pipeline or any of a hundred reasons why accumulation is occurring. On a chart these can be the lows of a movement, a consolidation area, congestion band or other level where buying happens. As a chartist and technical analyst we can mark these areas for future reference with lines, usually horizontal, that extend to the right, of into the future. We want to mark these areas because if a price level is attractive one time, it will most likely be attractive again. Anytime in the future that prices hit your line in the future it will provide support again.
How Do You Draw Support Lines
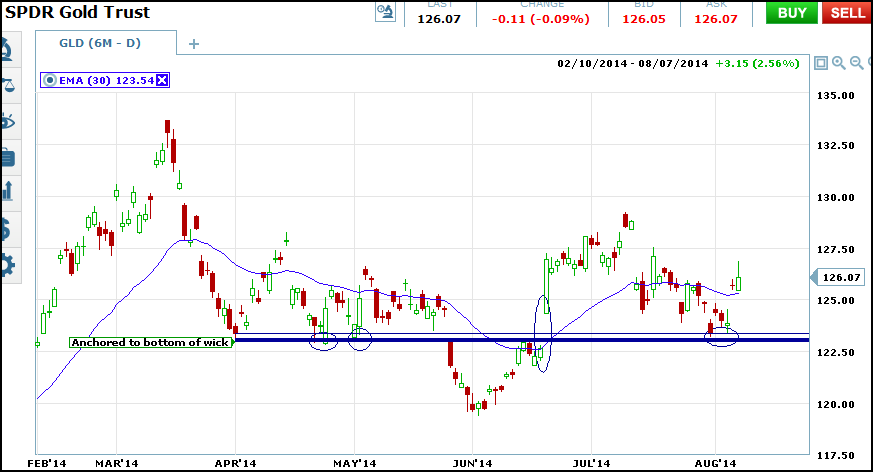
So, where do you actually draw your lines? This can be very subjective but I suggest at first draw them anywhere that looks relevant, as you practice you will get better at picking where to draw. Until then I have a few tips. First, when it comes to charts I always use candlesticks so when I draw my lines I have two choices; the lowest close and the lowest wick. I always draw lines from both places. Now, when I am using a congestion area or consolidation band as an anchor for my support line I do the same thing, I draw one line from the lowest close, and one from the lowest wick, and sometimes I draw additional lines around those areas as I see the need. In the end though, based on my experience, it will be the line drawn from the lowest wick that has the most importance. Look at the chart below. I have drawn two support lines from the same bottom. One is anchored to the bottom of the wick, the other to the close of the day. Moving forward we can see that both lines act as support but the upper line, the one anchored to the close, is broken more often and by greater amounts. This could lead to unnecessary false signals and losses, especially in a strong market where the breaks may be even more pronounced.
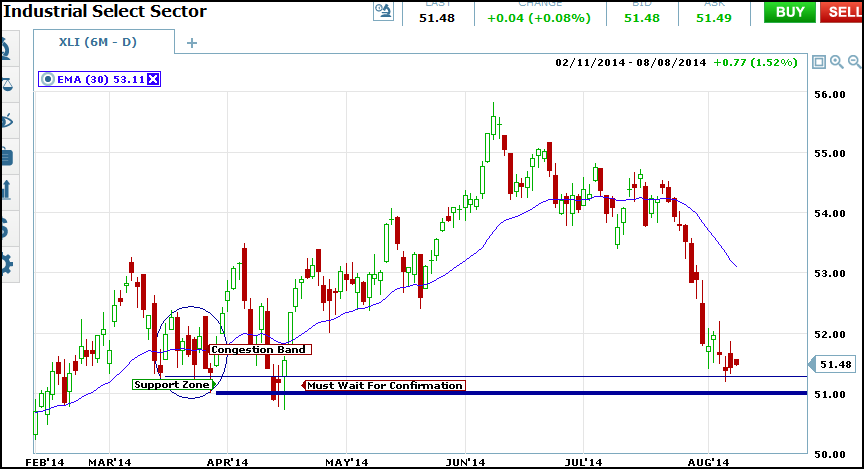
Now let’s look at another chart. I have drawn two support lines from a congestion band. This is an area of consolidation and trading that is more or less within a tight sideways range. I drew my lines from two likely candles, both at the bottom of the wick, creating a support zone that projects out to the right. We can see almost immediately following there is a test of support in which not only one but both lines play a roll, and the zone between them. The first candles breaks the upper and lower support lines with a nasty bearish candle. This bearish candle is apparently being confirmed by the second candle, the doji which forms beneath the upper line, but still within the overall support zone. Then the third and confirming candle tests support again before it completes the bounce and takes prices back above the upper support line. I hope that this example helps to drive home the importance of waiting for a confirmation. If you were to use only the upper line, or make your trade based on the second candle (the doji) or even before the close of the third candle you may have been led to a bearish trade.