Two Rules For Support And Resistance
Support and resistance are one of the most basic forms of technical analysis. Like many other tools of the trade, being basic does not make it simple. Identifying and using support and resistance, S/R, successfully as part of your daily trading routine takes time and practice. I am here today to help you gain an understanding into what S/R is, what it means and how you can profit from it. Like a moving average, S/R is a simple line drawn on a chart. Also like moving averages, S/R can be used in a variety of ways to generate signals and identify areas where the market is likely to continue or reverse its direction. The thing is, these lines in and of themselves are not signals. Price action does not indicate a buy or sell simply because it reaches one of these lines and that is why so many newbies have a hard time employing this tool.
The first rule of S/R is that it is not a signal. These lines are target areas where signals may occur in the same was Fibonacci Retracements. If you do not know about this tool read my Three Rules For Trading With Fibonacci Retracements. When price action reach one of these lines then you begin to look for a confirmation in other indicators and the prices themselves. Stepping back a bit lets look at what S/R and S/R lines are. These lines demarcate areas of accumulation and distribution on your chart. This analysis is so vital to trading that there are many tools dedicated to it such as the Accumulation/Distribution Line. Accumulation is the term used for an area where the market is net buyers. As the market buys more of an asset it is said to “support” prices, or keep them at or near a certain level. Distribution is the term denoting an area where the market is net sellers. As the market sells more of an asset it it is said to provide “resistance” to higher prices. Together these two lines can create areas of reversal, provide fuel for break outs and even trap prices within a range. There are a few key areas for drawing S/R lines and they include peaks or troughs, congestion bands, recognizable price patterns, areas of previous reversal and others. Drawing your lines takes practice but once you get the hang of it will come with ease.
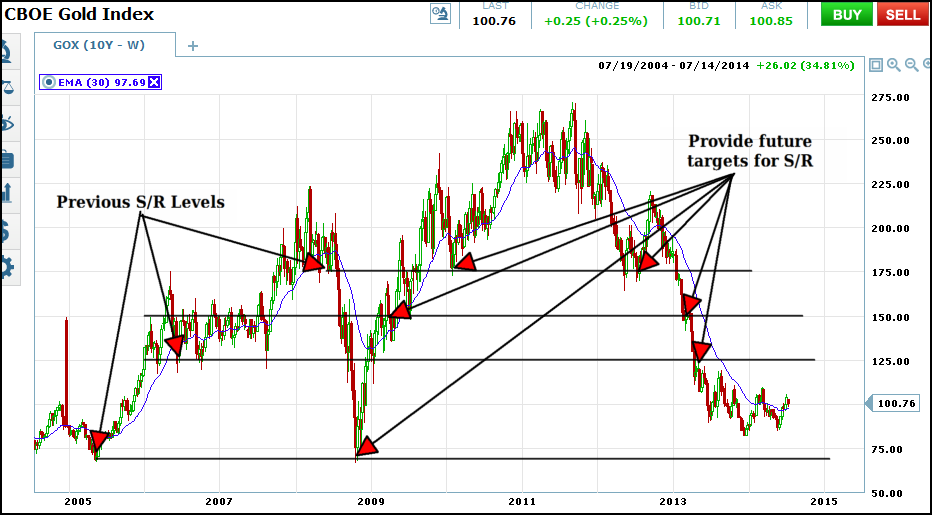
Let’s talk about time frame for a minute and then we’ll look at a chart. Support and resistance is effective in all time frames. The longer the time frame used to determine the S/R line the stronger the potential buying or selling will be. For example. A line drawn from a peak on a chart of weekly prices is stronger than a line drawn from a peak on a chart of daily or hourly prices. This is important to note because an S/R level from a higher time frame from the one you are trading in will impact your trading whether you know it is there or not. Also, keep in mind that once an area of support or resistance is identified it usually never stops being important. It will affect price action every time it approaches, no matter how much time has passed. I know this from experience and you can see it on the charts. Look below at the chart of the CBOE Gold Index. This is a ten year chart of weekly prices. You can see that levels of support and resistance from 2007, 2008 and 2009 affected prices in 2011, 2012 and 2013.
Support And Resistance Zones
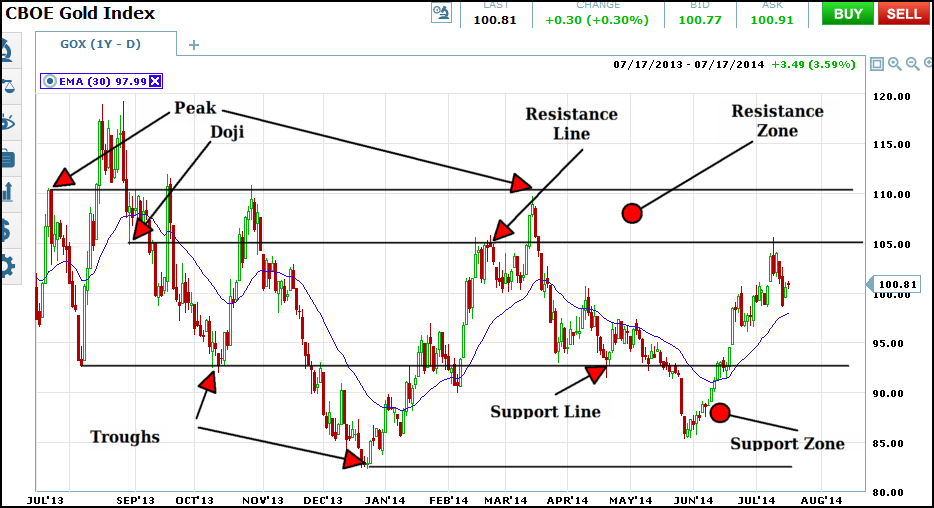
Sometimes support and resistance can be a little harder to define. Sometimes it can be zone of support or resistance rather than a signal price. These zones can form in a number of ways but are typically just an area where two or more potential S/R levels exist. As an example, a weekly candlestick with a long upper or lower shadow would have two potential areas of S/R, at the close and at the high/low of the day. Take a look at the chart of daily Gold Index prices below. On this chart the index is trending sideways making many peaks and troughs within the same range. Several potential zones have formed, I have marked two, one is an upper resistance zone, the other a lower support zone. Notice how sometimes a signal will come at the line, while other times it will occur inside the zone. This is why awaiting a confirmation is so vital when trading with this method.
So, the second rule for trading with S/R is that you must wait for confirmation. The lines are not a signal and there is no guarantee that an S/R line will hold when prices reach it. There are many other factors involved when trading and other indicators are a recommended. I like to use oscillators like MACD and Stochastic as well as other tools like Fibonacci Retracements, Bollinger Bands ™ . These indicators can give you insight into what may happen when prices reach a line you have drawn.