Top Cryptocurrencies Lugged Down by Sky-High U.S. Inflation
Bitcoin’s Triple Top Generated the Predicted Outcome
by Bogdan Giulvezan
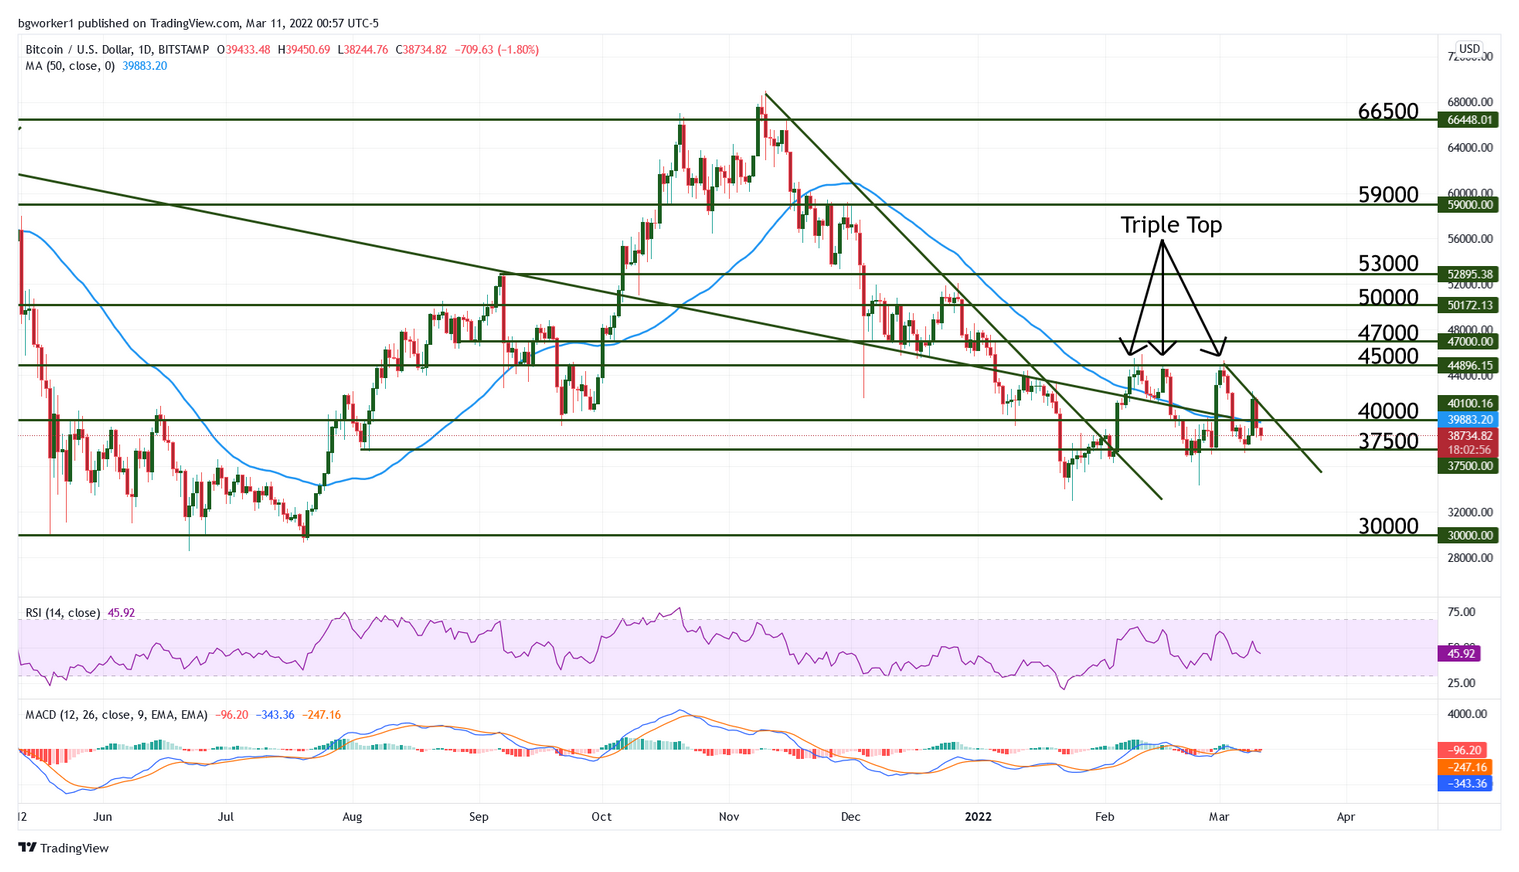
Last week we talked about a strong chart pattern that usually triggers a bearish move: the triple top. As expected, the bearish action started soon after, and Bitcoin travelled the entire distance from $45,000 to $37,500 in just a few days.
But Bitcoin seems to be a tame beast these days, because as soon as it hit $37,500 support, it bounced higher, reaching an intra-week top at $42,591 (TradingView chart, data from Bitstamp). Soon after, it erased the gains and returned closer to support, trading at $38,450 at the time of writing.
Part of the reason for the most recent drop is U.S. Inflation. As shown by the most recent CPI data, annual inflation has risen to 7.9%, which is the highest since January 1982. After Thursday’s CPI release, risk assets moved lower: the S&P500 closed 0.4% in the red, while the Nasdaq finished 0.95% lower.
Cryptocurrencies moved lower, in correlation with stocks and indices, but some voices say that Bitcoin may become some sort of hedge against inflation. We could be dealing with short-term decreases in price, due to panic, which will then be replaced by increased bullish pressure. However, that’s just speculation and Bitcoin is not a proven tool to shelter from inflation.
Technical Outlook – BTC/USD
Since early February, Bitcoin has been trapped inside a horizontal channel formed by $45,000 resistance and $37,500 support. The apex coin has bounced between the boundaries of the said channel with picture-perfect accuracy and uncharacteristic docility.
Every time BTC touched one of the channel’s borders, it immediately reversed and travelled the entire distance to the opposite side. However, after the last bounce at $37,500 support, the Bitcoin bulls didn’t manage to take the price all the way up to $45,000 and instead pulled a stop-and-reverse move at the short-term bearish trend line seen on the chart below.
This failure to climb to the top of the channel may spell disaster for Bitcoin bulls, or it could be just a temporary weakness, in part triggered by rising U.S. inflation and Bitcoin’s correlation with stocks and indices.
Looking at the technical indicators, we can see that the Relative Strength Index is moving in the middle of its range (meaning there’s no clear trend detected), and it doesn’t show any divergence signals. The MACD is also flat, with lines close together, which is another sign that momentum is lacking.
The levels to watch remain $37,500 as immediate support and $45,000 as resistance but also keep an eye on the short-term bearish trend line because a bullish break may trigger a stronger move up.