This Could Be The Ethereum Killer
EOSIO (EOS) – Overview And Long Term Price Forecast
Launched in July 2017, EOSIO aims to become the best infrastructure for building decentralized applications (dApps), bad news for Ethereum. Its blockchain architecture allows for vertical and horizontal scaling of dApps. This is made possible by emulating most of the characteristics of a traditional computer upon which traditional apps can be built. The resulting blockchain architecture has the potential to scale to millions of transactions per second according to EOS.IO official website. According to TokenGazer, the current number of transactions is around just 4,000 which is still way better than Ethereum’s few dozen.
EOS/USD Price Analysis – The Big Picture
Currently EOS is valued at 5.25 US Dollars and is ranked 6th on CoinMarketCap with a circulating supply worth $4,755,970,170.Since bottoming out around $1.55 in December 2018, EOS has been constantly ascending and recently managed to break a very important resistance level located at $4.60. Price action reacted to this level several times before breaking which makes the breakthrough that much more important. It also opens the door for a quick touch of $6.90 – $7.00 area.
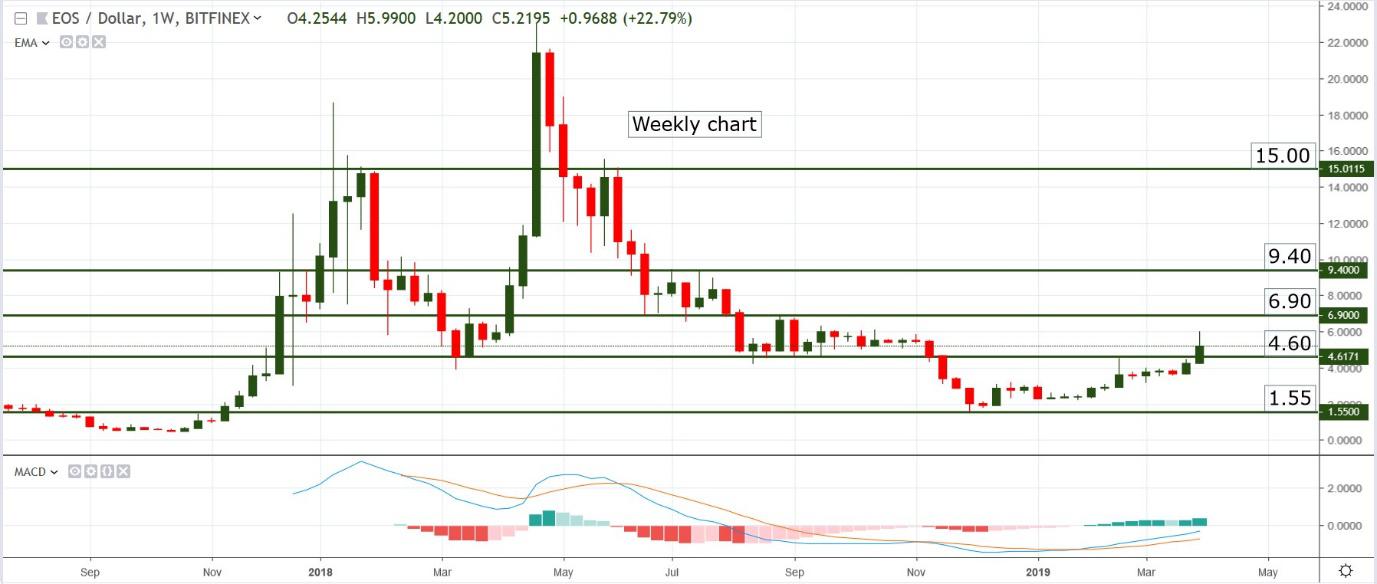
The Moving Average Convergence Divergence (MACD) on the weekly chart has crossed bullish and is now starting to show increased momentum (lines are moving further apart and the histogram is increasing in value). If the two lines will move above the histogram and we see a weekly close above $4.60 the bullish bias will become even stronger. At that time the $9.40 will become an achievable target.
On a Daily chart, price has moved above the 100 days Exponential Moving Average which is another bullish sign. This increases the possibility of an extended move up (even uptrend development) but it’s important to note the position of the Relative Strength Index (RSI). The indicator is deep into overbought territory which suggest the rally may already be topping out.
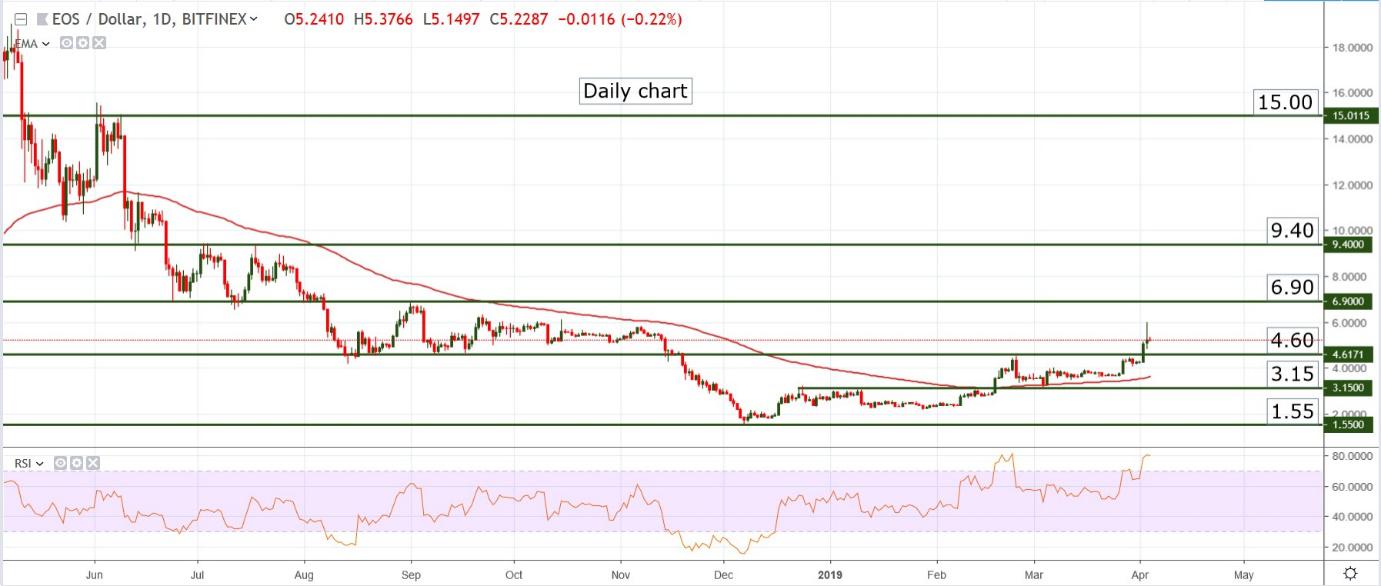
The chart above also shows a form of bearish divergence. Comparing the last two price tops with the last two RSI tops we can see that price is making a higher high and the RSI is not (more like a double top on the oscillator). This divergence combined with the overbought condition will likely trigger a retracement in the coming week but as long as price is trading above the 100 days EMA the outlook is bullish.
Daily Chart Support: $4.60; 100 Days EMA; $3.15; $1.55
Weekly Chart Support: $1.55 (possibly $4.60 but this level is not confirmed yet)
Daily Chart Resistance: $5.80; $6.20; $6.90
Weekly Chart Resistance: $6.90; $9.40; $10.00
Most likely scenario: Small retracements followed by a move into the resistance at $9.40. As long as price stays above $4.60 and above the 100 days EMA, there a high chance of upside action but keep in mind that until the target is reached, we will see more pullbacks.
Alternate scenario: Volatility could disappear just as fast as it appeared, which will give way to a ranging market with a bearish bias.