The Dollar Finishes Fifth Bullish Week Ahead of Jackson Hole
Powell & Lagarde’s Speeches: The Awaited Voices for FX Volatility.
The greenback finished its fifth consecutive week of gains against major counterparts, marking the longest streak in 15 months, with FX traders showing strong interest in the safe-haven currency. The Dollar Index (DXY), which gauges the dollar against a group of six major currencies, is close to a two-month peak. This comes after Thursday’s Fed meeting minutes left the door open for potential rate increases later in the year. Also, Tuesday’s Retail Sales and Core Retail Sales came in way above expectations, highlighting a robust U.S. economy.
The upcoming Jackson Hole Symposium will be this week’s main focus, with traders eyeing Fed Chair Powell’s speech for clues regarding the monetary policy and possible rate cuts/hikes for this year.
Key Data for the Week Ahead
Monday and Tuesday will be slow days in terms of economic releases but action picks up Wednesday with the release of Germany’s Flash Manufacturing PMI and Flash Services PMI, scheduled at 7:30 am GMT. Later, at 1:45 pm GMT, the focus shifts to the U.S. as the American counterparts of the same indicators will be unveiled.
Thursday marks the beginning of the renowned Jackson Hole Symposium. This annual event is a focal point in the financial community where central bankers, economists, and financial market participants gather to discuss prevalent economic issues.
On Friday at 8:00 am GMT, the German IFO Business Climate will be out, offering a gauge of economic sentiment in the country. At 2:05 pm GMT, all attention will be directed towards Fed Chair Powell as he will speak at the Jackson Hole Symposium about the economic outlook. The day concludes with ECB President Lagarde speaking at 7:00 pm GMT at the same symposium. Her insights, together with Chair Powell’s, are likely to stir up some FX volatility.
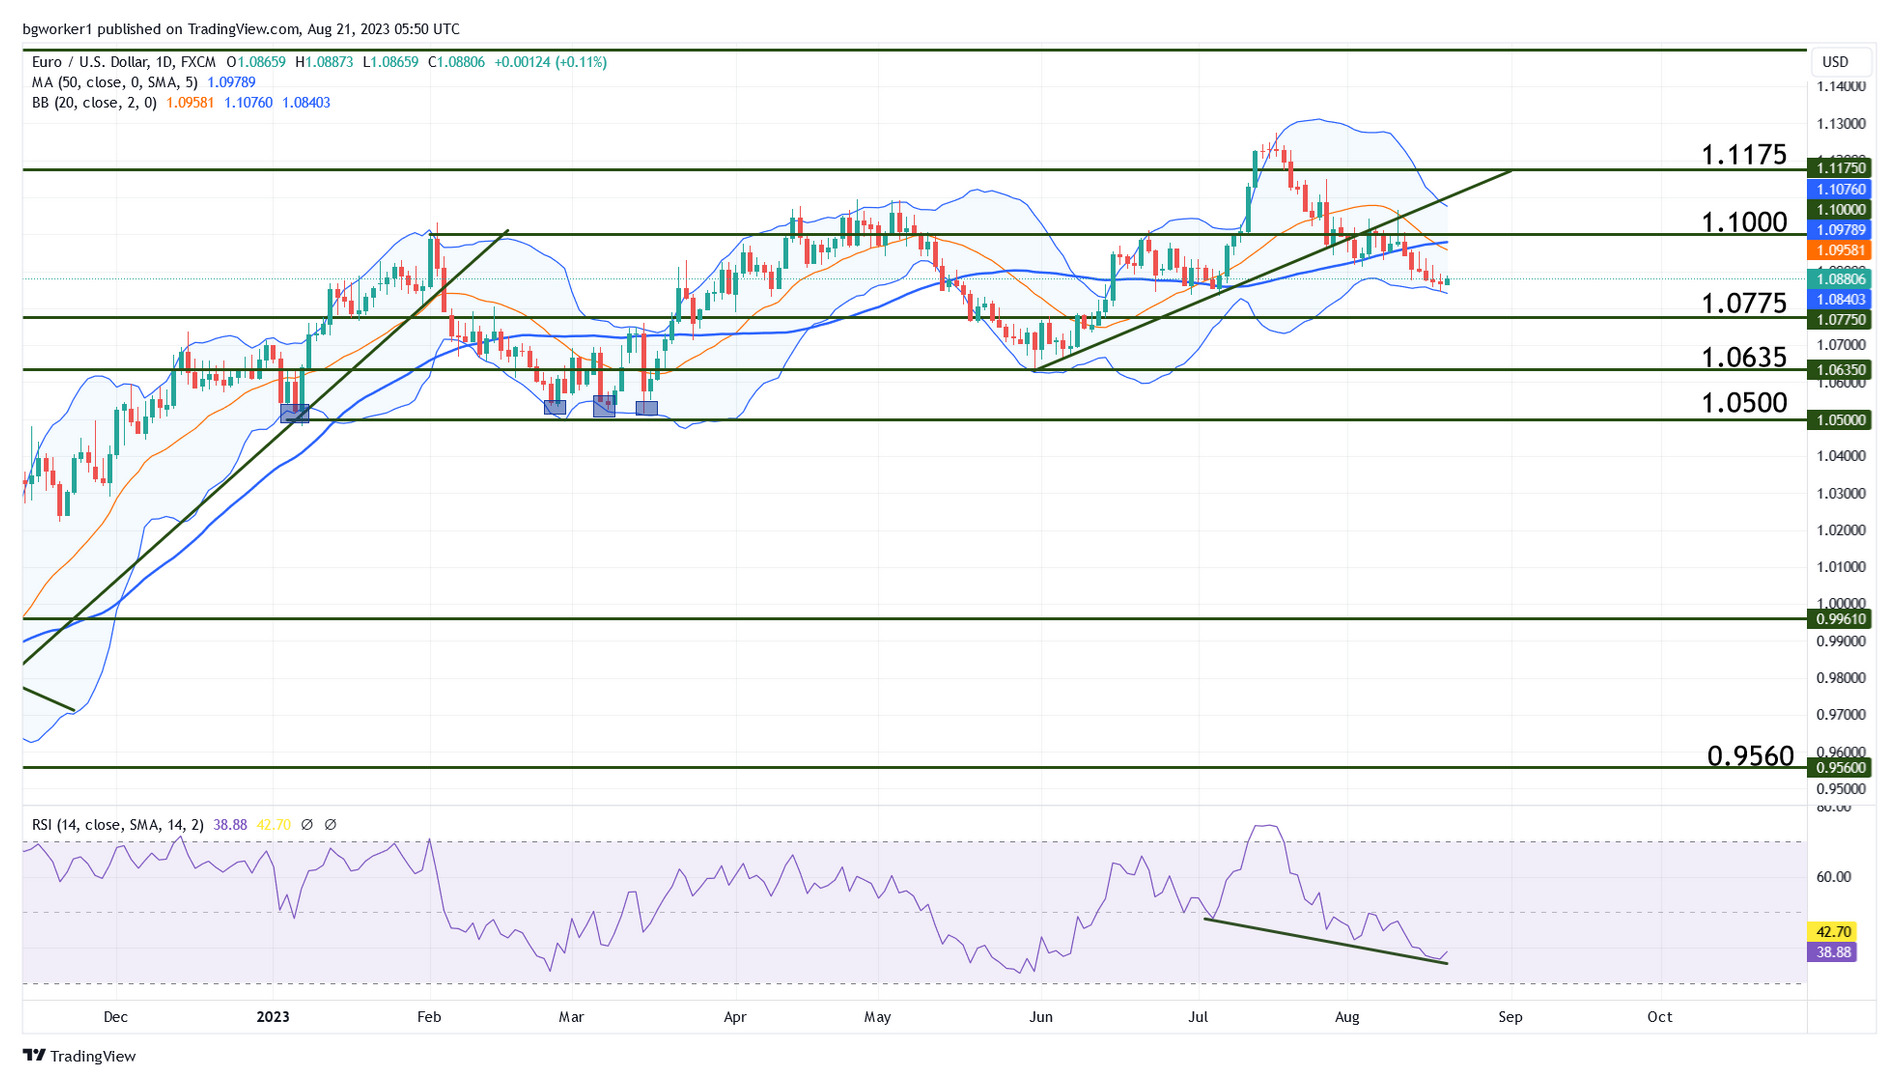
Technical Outlook – EUR/USD
Although the dollar has been on the offensive, the movement seems sluggish and without a lot of momentum. Candles are small and with long wicks, which indicates a lack of determination. Also, it must be noted that the chart is showing bullish divergence: the Relative Strength Index is making lower lows while the price is making higher lows. This suggests that a bounce higher may materialize in the near future.
If the EUR/USD bulls decide to take over, the first resistance is located at 1.0900 (big round number), followed by the 50-day Moving Average and the key level at 1.1000. To the downside, support sits at the lower Bollinger Band, followed by 1.0775.