Bitcoin Struggles at $70,000 Amid Rising Geopolitical Unrest
Range breakout needed to unlock $77K target
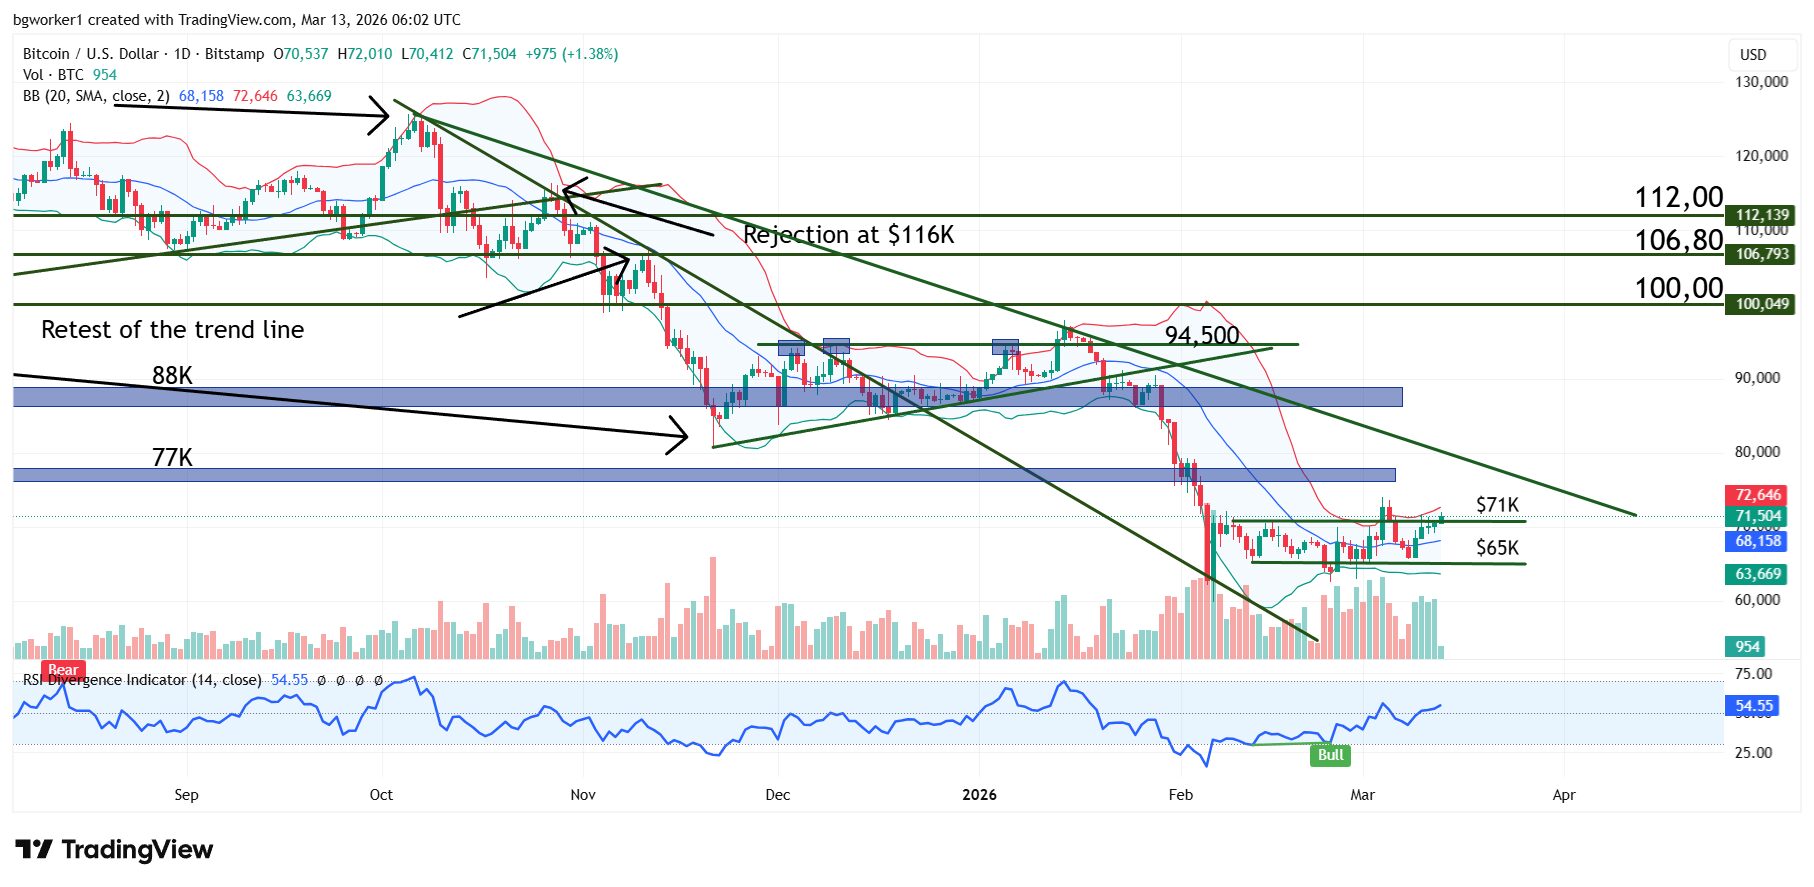
In the past two weeks, Bitcoin bulls have tried to stabilize the price above $70,000 and even breached the $71,000 barrier three times. Unfortunately, all these attempts were met with rejection, failing to develop into a sustained rally.
The main reason for crypto weakness has been the combined attacks of the U.S. and Israel on Iran and retaliation from the latter. While earlier in the week we had some optimistic comments from the U.S. President, hostilities continued, driving the price of oil above $100 and weighing heavily on stocks and crypto. However, the crypto market was less affected than stocks, showing some resilience.
President Trump suggested that the war would end soon, but during a speech in Kentucky, he also mentioned that U.S. military forces would stay as long as needed. “We do not want to leave early, right?” he added. Meanwhile, Iranian forces attacked several targets and disrupted traffic through the Strait of Hormuz, which is the biggest maritime pathway for oil transportation.
The overall risk-off sentiment fuelled by the Middle East conflict sent investors flocking to safe-haven assets such as the dollar and gold. However, Bitcoin was not heavily affected by these headwinds, which suggests it may be getting back some of its hedge appeal. Adding to this narrative is the fact that spot Bitcoin ETFs are still seeing daily inflows, despite the geopolitical unrest. According to Coinglass data, more than half a billion dollars were poured into Bitcoin ETFs during the first four days of the week.
Chart Analysis – BTC/USD
Since March 4, Bitcoin has tested the resistance at $71K several times and even managed to close a daily candle above it. After the initial push, the sellers stepped in and managed to take the price as low as $65,600. Currently, BTC is still hovering near $70K, but the candles are showing long wicks and small bodies, suggesting indecision.
Each time the price surged past $71K, the volume increased (this is better visible on the 1-hour chart), which is a sign that there is buying interest at this level.
The RSI is moving north after flashing a bullish divergence signal at the end of February. Although the price did move up after the divergence, it still has room to climb, considering that the RSI visited oversold territory twice recently, without a significant push higher afterwards. If the $65K – $71K range will be broken, we can expect a climb into the $77K area, followed by a test of the long-term bearish trend line.