The Bubble Pop Binary Options System
Every once in a while when perusing the internet for scams, sharks and shady dealings I come across something that is actually of value. Usually my first impressions turn out to be wrong but sometimes even I can be a little to harsh of a critic. The Bubble Pop System is one of those with a cute name that may turn out to be an affiliate scam or just useless. Adding to that impression was the incredibly small amount of details given in the original description. In the end though it turns out that this strategy, with the addition of information found in the comments and my own suggestions, is quite good. This is a trend following strategy for short term 30 minute binary options that uses Bollinger Bands ™ and the Parabolic SAR indicator.
How Does It Work
This strategy uses Bollinger Bands ™ and the PSAR indicator, two tools held in high regard by forex, futures and commodities traders. The B-Bands are based on standard deviation envelopes and are intended to measure volatility and to predict short term market direction. The Parabolic SAR, or Stop-and-Reverse, is an indicator most used in futures and commodities trading where traders wish to ALWAYS be in either a bullish or bearish position, hence the name. When used on it’s own the PSAR signals you to exit one position and enter another each time it “goes parabolic”. This strategy uses the two together to predict trend following strategy and in my experience so far work well together.
The signals are simple. You are to use the 15 minute chart for analysis and signals, only take trend following signals and use the standard settings for both indicators. What I like about this strategy is that once you have a grip on the underlying trend you can take your signals with very little care for anything else. I want to point out at this time that the original author cautions that you need “other market knowledge” to use this strategy properly. I assume this to mean longer term trend analysis and a fundamental grasp on market conditions. This is how the signals work. You are looking for the PSAR to “pop” the B-Band. What this means is in, in a trending market, that when the PSAR moves outside the B-Bands a signal is given. If the trend is up the signal happens when the PSAR moves below the B-Bands. If the trend is down the signal happens when the PSAR moves above the B-Bands. The first dot outside of the bands should be considered the signal as it usually precedes a fairly sharp movement. The farther outside the bands the first dot of PSAR occurs the stronger the signal.
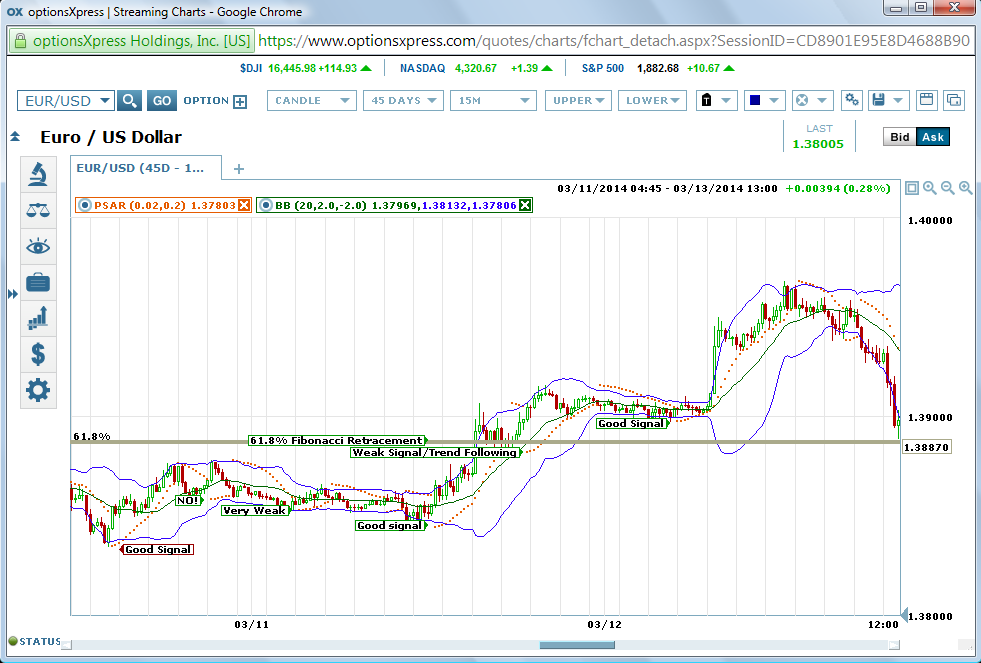
There is a chart attached to the strategy post but of course, to read it you have to join the website which I did not want to do. Seriously, how many websites can one person be a member to? Anyway, I made my own chart so that I could give it a better review. I choose to use the EUR/USD pair because it is one of the most heavily traded forex and binary options pairs. I used charts of one day and then 30 minute bars to pinpoint an area of up trend in order to back test. The I move down to the 15 minute charts to see what I could see. First off, I strongly recommend that you do not take any signals counter to the trend. From what I can see here they are all very weak signals and not worth your time. The other thing I can see here is a couple of good “Bubble Pops” that result in profitable trading.
My Take On The Bubble Pop
I think that this is a good strategy but like all strategies should be applied with caution. The two indicators will provide both bull and bear signals in either an up or a down trend so the first caution is to only use trend following signals as suggested. Another suggestion is to not be stuck on the 15 minute time frame. It seems to work well with the EUR/USD but may not be the best time frame for all assets. For the best, strongest signals wait for the PSAR to move well outside the the B-Bands. Even some of the trend following signals are weak and can be weeded out by their proximity to the punctured band. Some of the comments suggest that the strategy may only be about 50/50 right, others say 80-90%. I think, if using my suggestions and your own experience, this strategy can yield the 89-90% success rate. The thing is, you may have to wait for signals to develop. Even though it’s a 15 minute chart it’s only giving up 1-2 good signals per day, when it’s giving good signals. It will take patience but it can be done.
For more on the Bubble Pop System click here.