The Bitcoin Breakout We’ve All Been Waiting For
Bitcoin Breaks Out And Sends A Bullish Sign
Bitcoin broke above the $8,000 level giving a firm signal of bullish activity. This is the breakout we’ve all be waiting for, all of Bitcoin bulls that is. The price of BTC has been in consolidation for nearly a month after posting a near-record rally in the preceding months. The consolidation attempted to break above $8,000 a couple of times but was rejected each time, until now. Over the last 48 hours the world’s leading cryptocurrency drift up to $8,000 where it caught a wave of momentum and shot 10% higher in a mere 24 hour period.
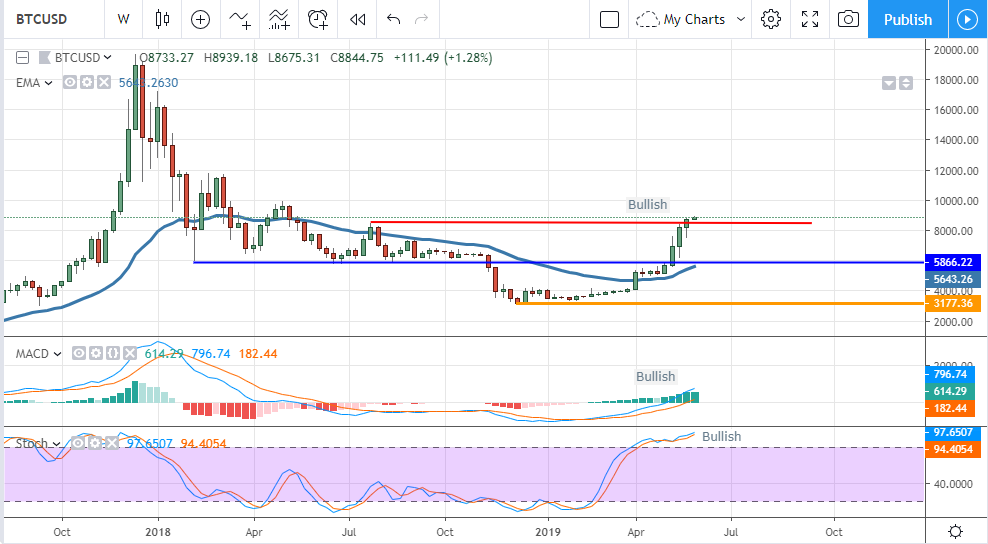
The breakout is a clear sign of bullish activity and slowly dwindling supply of bearish traders. Remember, there are no really good ways to short physical BTC which means you have to own BTC in order to sell it. The price action over the last 12 months suggests the massive wave of selling that began with China’s crackdown on BTC is over. What I see in the charts is that there are a dwindling number of holders of BTC who want to sell and those that do are realizing they can do so at a higher price.
The $8,000 level marks the top set last July. This top was the last major top before BTC prices broke down to hit the lows around $5,000. Now that this level is broken the market is back into solidly bullish territory and at levels were larger moves can be expected. The next major target is near $12,000, once that is broken that next is $16,000 and then $20,000. There is a chance of some resistance at the $9,700-$9,900 level but I think it will be short-lived. Traders at this level, once the market reaches it in bullish-fashion, will be easily converted to HODL’rs and help support the next wave higher.
Litecoin Is Throwing A Bullish Signal
There isn’t much to say about Litecoin other than it is throwing a bullish signal. The weekly charts clearly show an asset moving above a key resistance point with supporting technical indications. The first and most obvious is the candles. The candles are moving up from support at the 150-day moving average and forming a Rising Methods continuation.
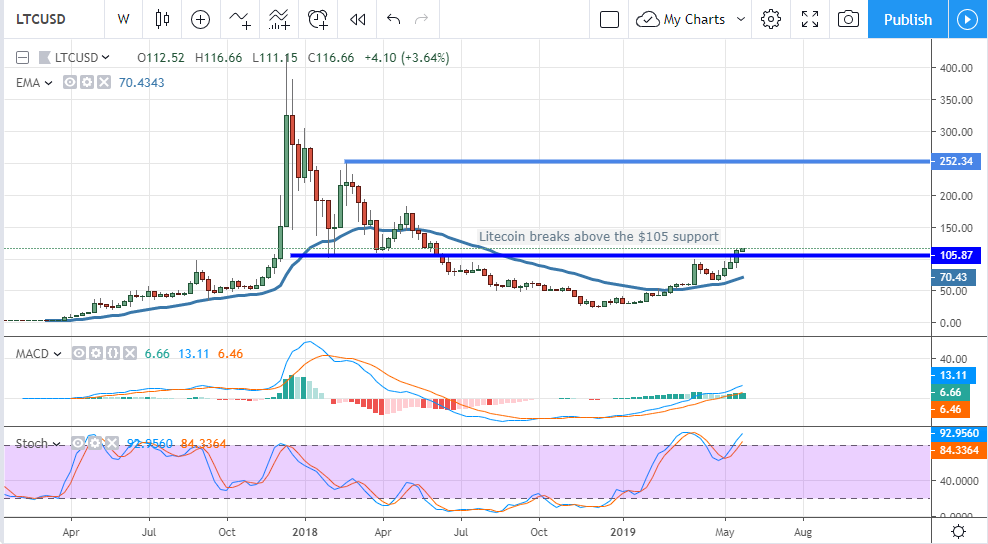
I call it a Rising Methods instead of Rising Three Methods because there were six candles between the two long green ones. The key points are that the long green candles are present and bullish in and of themselves, the second green candle opens high and then closes higher than the first, and the intermediate candles confirm support at the moving average.
Along with that the indicators are also bullish. MACD is firmly bullish, steady and ticking higher with the latest candles. The stochastic is bullish, showing strength by moving above the upper signal line, and has some room to move higher. Taken together the indicators show positive upward momentum in a market that is strong and has room to run. My next target for LTC is $183.50, and then $252.00, and then $400. Once LTC gets to $400, likewise when BTC moves up to the $20,000 range, but once that resistance is broken I think both will easily double with such quickness it shocks the broader mainstream investment market.