RSI Crossover Entry Strategy for Trending Markets
The RSI is a versatile indicator, and can be used to provide entry signals during a trend. To get the signals a moving average is applied to the RSI. This is easily done on free charting platforms provided by brands below. Just add the RSI to your chart, click on the dropdown menu next to “RSI” and select “Add Indicator.” From the list that comes up, pick “moving average.”
Best RSI Crossover Charting
RSI Settings
The standard RSI setting is 14, although that is typically used on daily charts, so if you are trading a shorter time frame you need to do some experimenting.
For the examples below I used an hourly chart with a 21-period RSI, along with a 10-period moving average of the RSI. This seemed to produce decent trade signals once the trend was established.
RSI Trend Strategy Guidelines
To apply the strategy a trend must be in place. For an uptrend we are looking for overall higher swing highs and higher swing lows in price. For a downtrend we are looking for overall lower swing lows and lower swing highs in price.
- Trades are only taken in the direction of the trend. For an uptrend only take longs. For a downtrend only take shorts (puts).
- During a downtrend the RSI must move above 60 to indicate a pullback. When the RSI crosses back below its moving average (can be at any number, just as long as the RSI is or was above 60 recently) go short.
- During an uptrend the RSI must move below 40 to indicate a pullback. When the RSI crosses back above its moving average (can be at any number, just as long as the RSI is or was below 40 recently) go long.
- Give the price at least two or three bars (whatever time frame you are trading on) or more before considering an exit. This gives the price some time to move in your favor.
Figure 1 shows how this RSI entry strategy could be used in an uptrend.
Figure 1. RSI Buy Signal
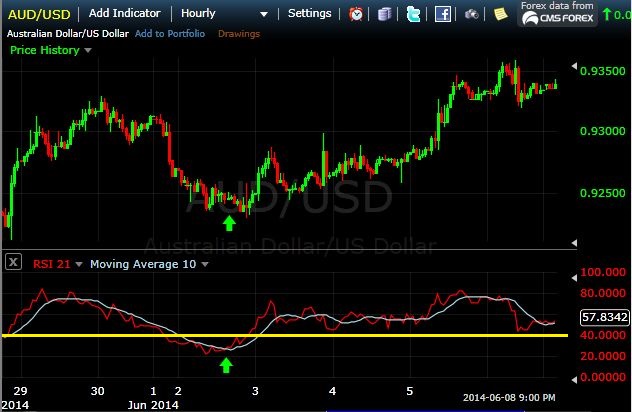
The trend is up so we are only looking for buy signals. The RSI drops below 40 (horizontal yellow line on RSI) indicating a pullback. Once the RSI has dropped below 40 we buy the next time the RSI (red line) crosses above the moving average (white line).
Figure 2 shows how this RSI entry strategy could be used in a downtrend.
Figure 2. RSI Sell Signals
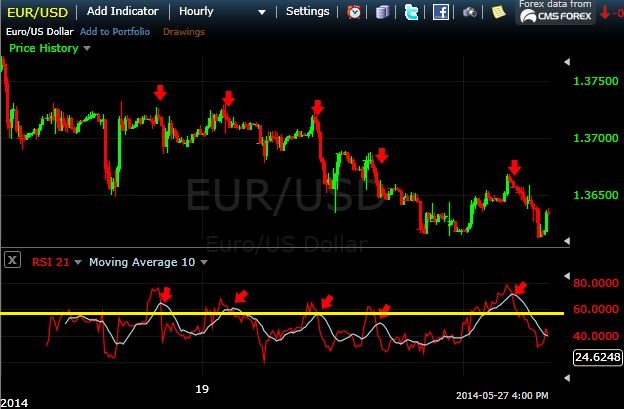
The EUR/USD is in a downtrend so only short (put) positions are considered.
Even though the price is moving mostly sideways from the left to the middle to the chart, the overall trend is down. Therefore we can still take short positions as the downtrend is still in play.
When the RSI moves above 60 it indicates a pullback. Once the RSI has moved above 60 (yellow horizontal line) we go short the next time the RSI (red line) drops below its moving average (white line).
The 40 level during an uptrend, and the 60 level during a downtrend, act as trade filters. By waiting for the RSI to move beyond these levels we are entering the trade during a pullback in the direction of a larger trend. When the RSI crosses its moving average it signals that the trend is likely resuming.
Final Word
This is only an entry method. If trading traditional markets place a stop loss above the recent high for short positions and below the recent low for long positions.
A Fibonacci expansion tool could potentially be used to find target prices.
If trading binaries you’ll need to isolate the proper expiry time by doing a bit of research on how long it takes for the price to typically move into the money.
Each pair or market may also work better with slightly different RSI settings. Once you find a trend, tinker with the settings slightly to find ones that work consistently with that pair, time frame and market.