Risk-Off Sentiment Grips Cryptocurrency: Bitcoin Dives Below $40,000,
Altcoins Play Follow-The-Leader
The apex cryptocurrency – Bitcoin – has been on a skid since early-November 2021 but earlier this month it showed some bullish signs, making us anticipate that a bottom is near. However, just as bullish action seemed to pick up, Bitcoin dropped through the crucial support at $40,000 to an intraday low of $38,250, which is the lowest since last August.
Currently, BTC/USD is trading at 38,750, with almost 10% lost during the last 7 days but some of its peers have it even worse, with 2-digit losses. Binance’s BNB is bleeding red with a 12.70% loss over 7 days, Ethereum is trading at $2,850, which is equivalent to a loss of 13.45% during the same period. One of the biggest losers is Dogecoin (-24.15%), followed by Polkadot (DOT) with -18.47% and Solana (SOL) with -16.60%.
The exact reasons for Bitcoin’s crash are unknown but rumors point towards Russia and the United States. On January 20, the Bank of Russia issued a 37-page report, saying that crypto mining and transactions should be banned completely. Considering that Russia is currently the third-largest Bitcoin miner, and a major player for transaction volume, the central bank’s position may have some bearish implications for BTC.
In the U.S., the Fed issued a highly anticipated report on CBDC (Central Bank Digital Currency). Although the Federal Reserve stated that a CBDC may offer a “safe, digital payment option” for individuals and “faster payment options between countries”, the report also said that CBDCs could bring additional risks to financial stability. At the moment, talks are still ambiguous and it’s not clear how the Fed will proceed.
Is it possible that some market participants view a digital US Dollar as a Bitcoin adversary? If so, this rivalry combined with Russia’s crypto ban could be the reasons behind the drop below $40K. Let’s take a look at the charts.
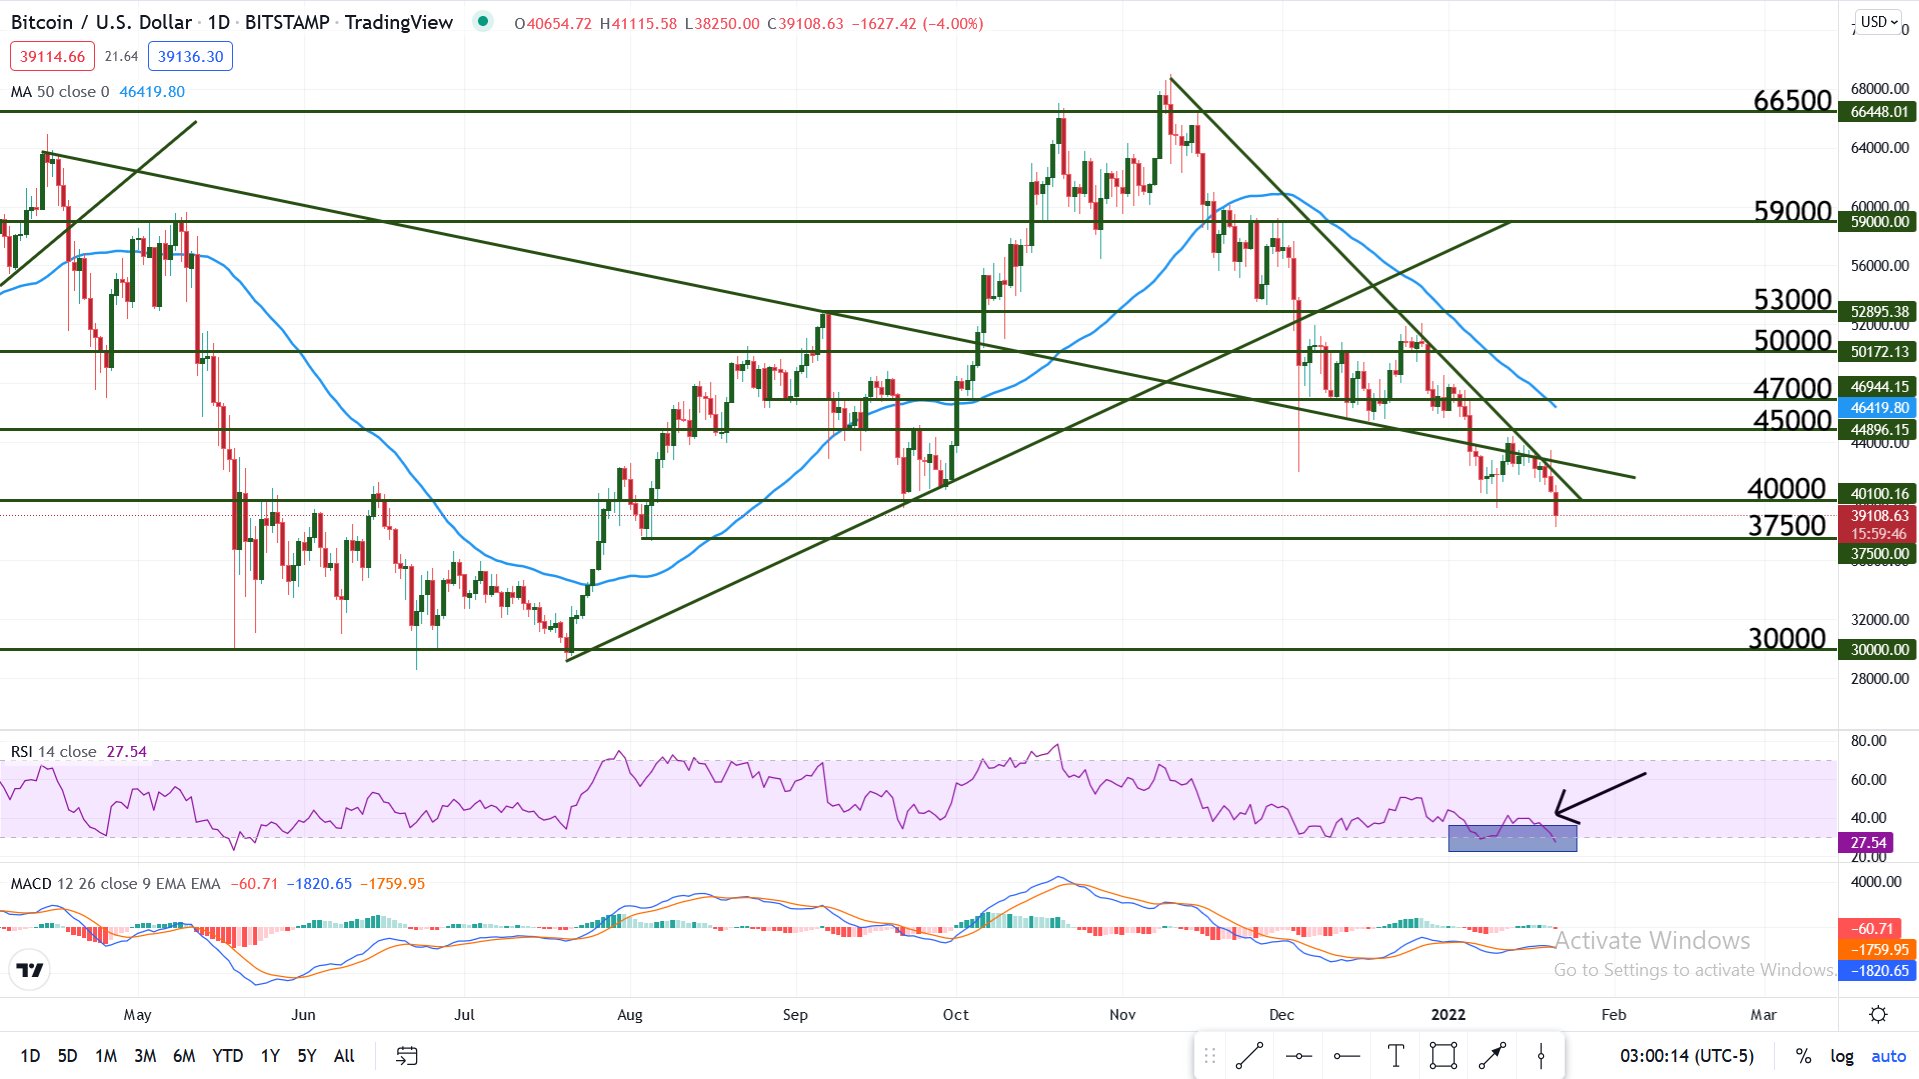
Technical Analysis – BTC/USD
The fact that Bitcoin dropped below the key handle at $40,000, which is both a psychological and a technical level, shows that the bears are still in control, and opens the door for a touch of the next support, located at $37,500.
However, there are some bullish hints on the chart as well: on the Daily chart the Relative Strength Index has entered oversold territory for the second time in a short while and on a Weekly chart, the same indicator shows hidden bullish divergence. This type of divergence occurs when the price is making a higher low and the indicator is making a lower low, and usually suggests that a move up will follow. Just keep in mind that signals that come from long-term timeframes can take a while to materialize.
For the time being, the balance of power clearly favors the bears but a bullish bounce can happen around $37,500. Whether that move can turn into a reversal or not, remains to be seen.