Opening Range Breakout
The opening range breakout has long been a daily event many stock traders monitor. It is a way to let volatility subside a bit by waiting on the sidelines when the market opens (or trading another strategy), and then taking advantage of the trend that follows.
The Right Stocks
Before getting into what the opening range is, or how to trade it, determining what stocks to use is just as important. While the strategy could be applied to stock indexes, or stocks that very closely mirror the major indexes (such as the S&P 500), I prefer to use more volatile stocks. Stocks that are trending very strongly down or up, or have had a lot of volatility recently are ideal candidates.
The Opening Range
The most common opening range is based on the first 30 minutes of trading, following the official market open. This applies to US equity markets, but may apply to other global equity markets as well (test it out, because I haven’t).
The price will gyrate for the first 30 minutes, creating an early day high and low. These highs and lows are marked on the chart to create the opening range.
Figure 1 shows the opening range in Best Buy (BBY), a stock that saw tremendous upside in 2013 and moves about 3% per day (compared to the S&P 500 which moves less than 1% per day).
Figure 1. Best Buy: 1 Minute Chart, January 7 2014
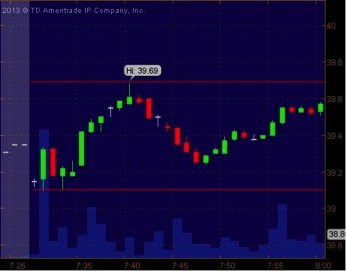
(Times in Mountain Standard, open is equivalent to 9:30 Eastern Standard).
This is the opening range. It’s very simple to mark on the chart, and provides the basis for the strategy.
Awaiting the Breakout
Once the opening range has been drawn we simply await for a breakout. Here are two basic entry methods.
- Enter as the breakout occurs. As soon as the price crosses above the high, you buy. As soon as the price crosses below the low you sell.
Figure 2. Sell on New Daily Low
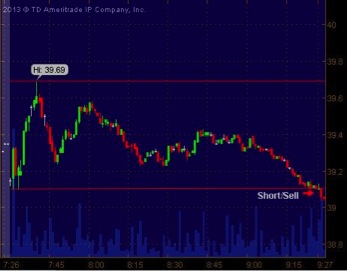
It took some time, but eventually the price crosses below the daily low, setting up a short trade, as the expectation is that the price will continue to drop.
- The other entry is to let the first entry pass by, let the price drop (in this case) and then only enter if the price pullbacks to the former low (in this case), holds there, and starts to drop again.
Figure 3. Alternative Entry after Pullback
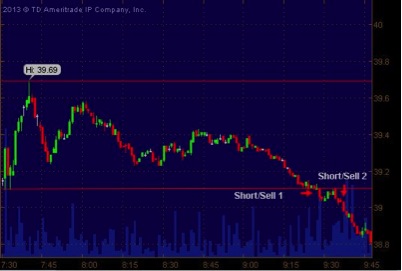
After the breakout the price moves lower slightly and then pulls back to the breakout price. It can’t move through this area, and then starts to drop again. Once the price starts to drop again it confirms that the price is likely to continue to drop.
The second entry provides more confirmation because we now know the price wasn’t able to rally following the breakout, and is now dropping again. The downside is that sometimes these pullbacks don’t occur, and thus we may miss a trade.
Managing Risk
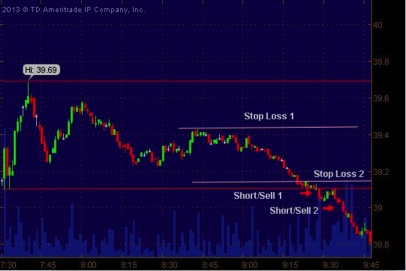
There are two main places to put a stop loss on these types of trades:
- Traditionally risk is managed is by placing a stop above a recent swing high in the case of a downside breakout, or below a recent swing low in the case of an upside breakout. This exposes the trader to great risk, but is less likely to get stopped out by a small pullback.
- The alternative is to assume the price is unlikely to come back into the opening range once it breakouts out. Therefore, the stop is placed just inside the range, preferably above the highs of the last couple bars within the range (for a downside breakout, and below the lows of the last few bars on an upside breakout). This strategy exposes the trader to much less risk, but the chance of getting stopped out on a small pullback is higher.
As the price drops, the stop loss can be trailed down behind the price if desired.
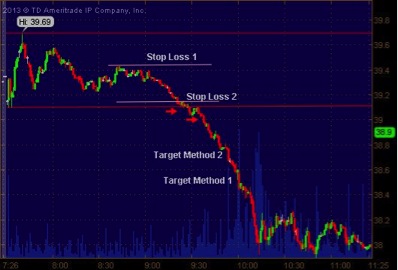
Figure 4. Stop Loss Placement
Taking Profit
Taking profit can be a more complex matter. Here are two ways to take profit, one simple and one more complex.
- Take profit once the price has broken out the same distance as the opening range. For example, if the opening is $0.50. Take profit when the price is $0.50 outside the range.
The range shown in the charts above is approximately $0.60, and the range low is $39.10. Since the breakout was to the downside, when the price reaches $0.60 below the breakout point, $39.10-$0.60=$38.50, take profit.
The second profit target is more complex. It requires that you know how much a stock moves on average within the day. If there aren’t a lot of gaps on the daily chart, then a daily Average True Range can be used as a substitute. At the time of writing the 14-day Average True Range is $1.16.
- Assume that the price will move close to what it does on a typical day. Find the target by subtracting the Average True Range from the high of the day in the case of a downside breakout, or adding the Average True to the low of the day in the case of an upside breakout. Round the ATR down to increase the likelihood the target will get hit.
If the ATR is rounded down to $1, this is subtracted from the $39.69 high to get a target of $38.69. This target is based on something more substantial–the stock’s actual tendencies–than the first less complex target mentioned prior. In this case, the stock had a larger than usual move, therefore, both targets were exceeded.
Figure 5. Targets
Sometimes using target 1 will yield a bigger a profit, and sometimes target 2 will yield a larger profit. The two targets can also be used in to conjunction to come up with a “hybrid” target.
Traders may also wish to simply hold the profitable trade until the price action slows down significantly–such as what happened between 10:15 and 11:25 on the chart, or the price begins to move in the opposite direction. On bigger than normal moves this may capture a larger profit.
Final Word
This is an introduction with some potential ways to trade the opening range. There are many other ways to trade it as well. Experiment with different time frames, entries, targets and risk management methods to find something that suits your individual trading style and circumstances.