NFP and Fed Rate Decision: A Defining Week Ahead
Technical Spotlight: EUR/USD Faces Key Resistance Points.
We are headed into a busy week, as the Fed is getting ready to meet to discuss the interest rate on November 1st, followed by the Non-Farm Payrolls report on Friday. Last week the American economy showed signs of resiliency, with the quarterly Advance GDP exceeding expectations and reaching 4.9%.
The U.S. Core PCE for September matched expectations at 3.7% year-on-year and +0.3% month-on-month. August’s annual PCE figures, both headline and core, underwent downward revisions. The annual metrics indicate that inflation is cooling off.
At the time of writing, there’s only a 3.8% chance that the Fed will increase the rates this week, according to CME’s FedWatch tool. This puts more emphasis on Fed Chair Powell’s press conference and the rhetoric he will use.
Key Data for the Week Ahead
Today at 12:00 pm GMT, traders will focus on the German Prelim CPI, which is the main gauge of inflation for the German economy. Tuesday we take a look at the Eurozone Core CPI Flash Estimate at 10:00 am GMT and the U.S. Consumer Confidence survey later at 2:00 pm GMT.
Wednesday is the big day for the dollar as the FOMC convenes to announce the interest rate and to release the usual Statement that contains the rate votes and commentary on the reasons that determined the decision. The release is scheduled at 6:00 pm GMT and will be followed half an hour later by Jerome Powell’s press conference.
Thursday at noon, the Bank of England (BoE) will announce the interest rate, which is not likely to see any modifications. The last and one of the biggest events of the week is scheduled for Friday at 12:30 pm GMT: the U.S. Non-Farm Payrolls, alongside the Average Hourly Earnings and the Unemployment Rate. Together, these economic indicators paint an accurate picture of the U.S. labor market, which has a huge impact on the greenback.
Technical Outlook – EUR/USD
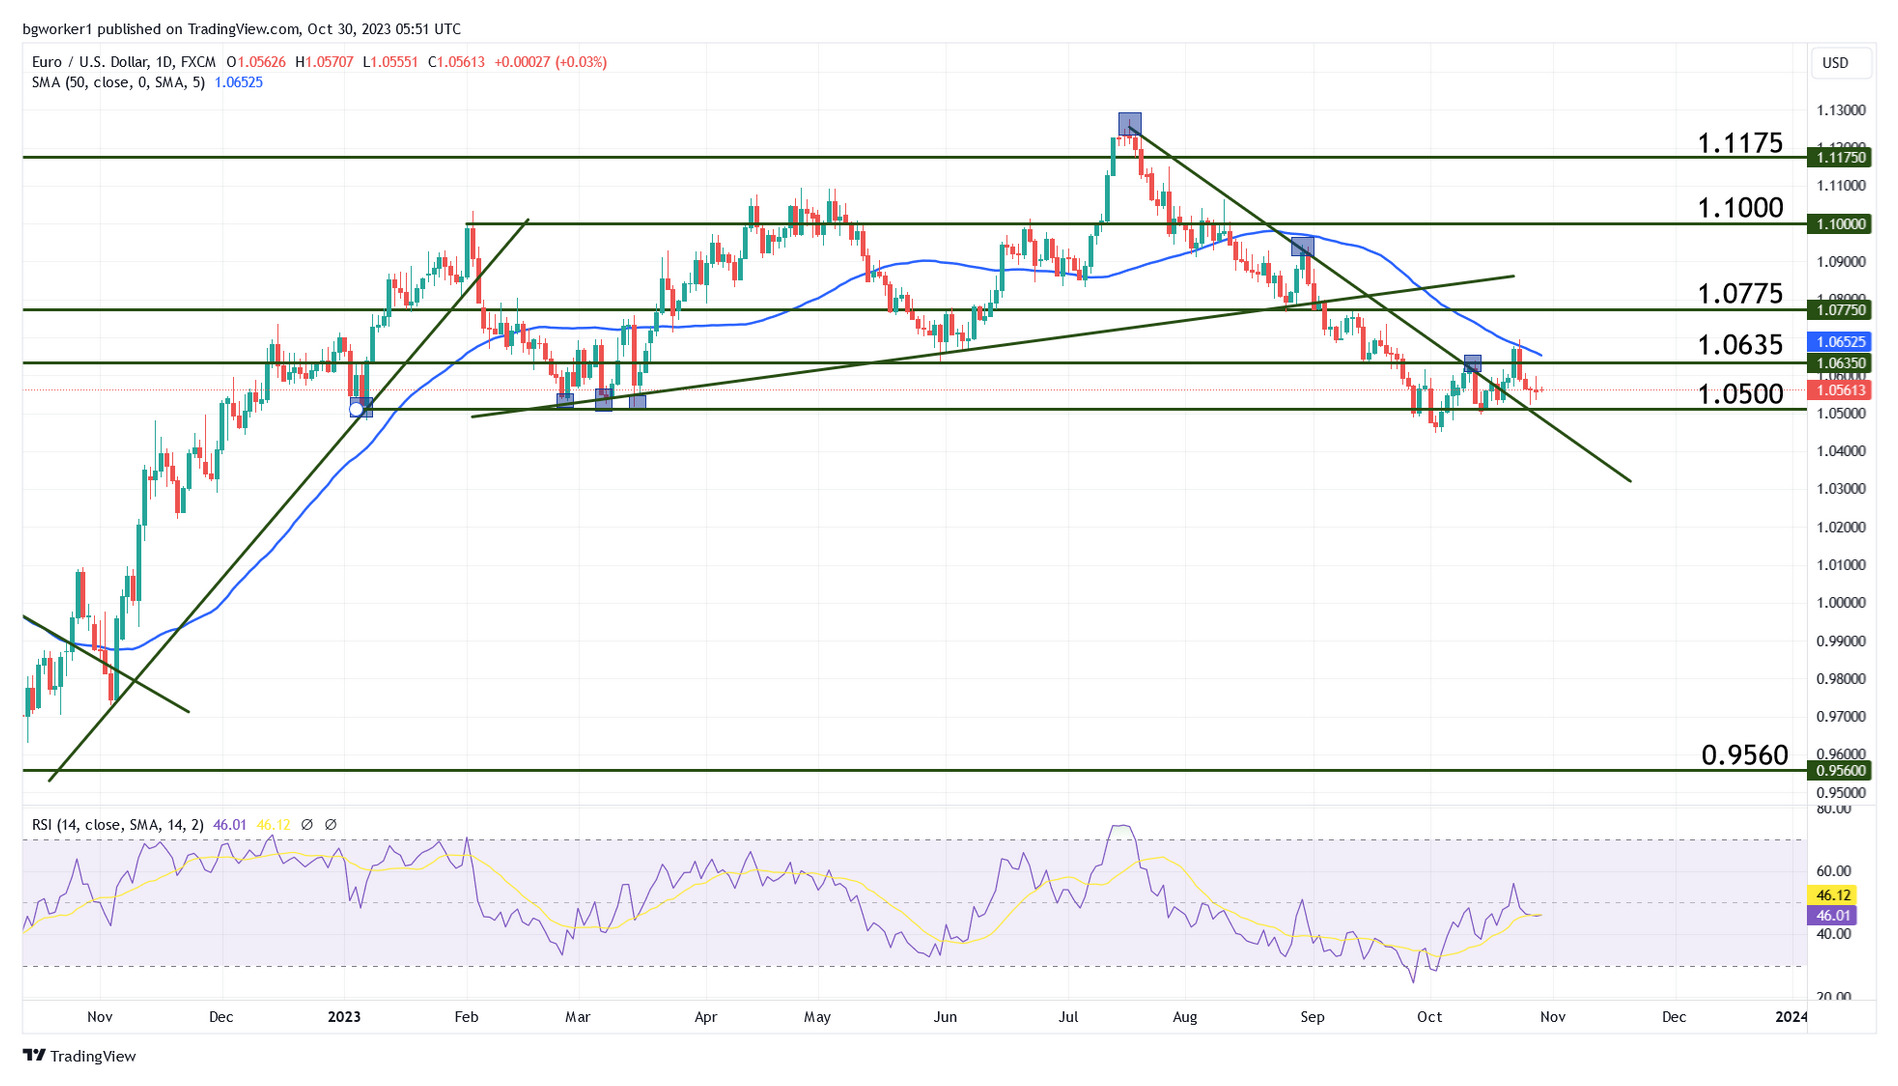
The pair has clearly exited a bearish trend line, after being oversold as indicated by the Relative Strength Index. However, the bullish breakout met with resistance at the 50-day Moving Average and at 1.0635.
The horizontal resistance level (1.0635) was breached and an engulfing candle appeared immediately after the rejection. The red candle’s body engulfed the body of the previous green candle. This type of pattern shows strong pressure, in this case bearish.
Thus, we are dealing with a rejection at a confluence zone (the 50-day MA and the horizontal level at 1.0635) and a strong engulfing candle. These are signs that point towards another leg of the downtrend; however, a lot will depend on the data that is set for release throughout the week.