How to Use Fibonacci Arcs
Fibonacci Arcs don’t get a lot of press compared to Fibonacci Retracements or Extensions, yet Arcs offer something these other indicators do not–a time element. While retracements and extensions are concerned with just the magnitude of moves, Arcs factor both magnitude and time, offering areas of future support or resistance that will move as time progresses.
Fibonacci Arc
The Fibonacci Arc is drawn directly on the chart. Similar to other Fibonacci tools the tool connects a swing high and swing low, which then creates series of arcs.
The Arcs occur at Fibonacci retracement levels: 23.6%, 38.2%, 50%, 61.8% and 76.4%. Although by default, usually only the 38.2%, 50% and 61.8% are shown. The levels are not horizontal though, as with Retracements and Extensions.
Figure 1. USD/CAD with Fibonacci Arc
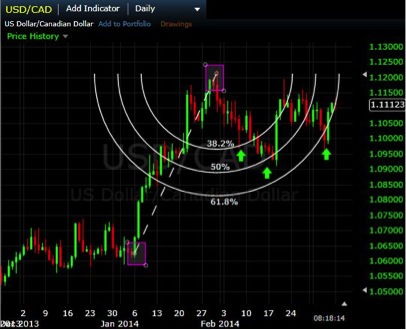
The pink boxes represent the start and finish of a major price wave, and therefore the indicator connects these points. The Arcs are then automatically displayed, showing the 38.2%, 50% and 61.8% retracements levels.
In this case, the pullback that followed touched each of these levels and bounced off of it.
When the Arcs are drawn over a large price wave, the Arcs will be large to compensate. On the other hand, small Arcs will appear if the tool is used on a small wave.
Applications
Fibonacci Arcs can be used on all time frames, from 1-minute charts to monthly charts and are applicable to major markets, such as stocks, forex, commodities and bonds.
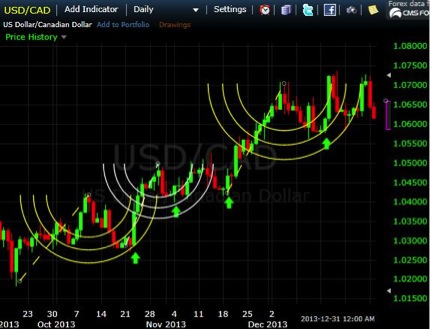
The Arcs can be drawn on major waves, like in Figure 1, which contain a number of small waves within them, or the Arcs can be drawn on each smaller wave. Drawing the Arcs on each smaller wave, as shown in Figure 2, is more applicable to active traders who want in and out on each wave. Figure 2 shows some smaller wave leading up to the wave shown in Figure 1.
Figure 2. USDCAD with Fibonacci Arcs on Consecutive Waves
Drawbacks
The price is unlikely to respect the exact price of a Fibonacci Arc level. This means simply placing a buy order at one of the pullbacks level as shown in Figure 1 or 2, isn’t likely a viable strategy.
In advance, we also don’t know which of the Arcs it is eventually going to respect.
Drawing the Arcs can also be somewhat subjective. If you and I connect different highs and lows we will get different Arcs. If the Arcs are used for trading then it follows that the trading results could dramatically vary, which makes testing Fibonacci Arcs as a strategy rather difficult.
Because of these drawbacks Fibonacci Arcs are generally used as analysis tools, or confirmation tools, as opposed to actually providing trade triggers.
Final Word
Fibonacci Arcs are an interesting chart overlay because they factor both price and time. Typically they should be used as a confirmation or analysis type tool; highlighting areas which are likely to provide support or resistance. If you receive a trade signal from your strategy, and the signal occurs in the vicinity of one of the Arcs, then the Arcs would confirm the signal. As always, practice using and test out an indicator before utilizing it with real capital.