How to Use False Breakouts to Your Advantage
While I do watch for price breakouts, I am always on the lookout for false breakouts…because I want to trade those more. Most traders view false breakouts as a bad thing, a market phenomenon that cuts into their profits or increases their losses. I propose you look at false breakouts as an opportunity. In my opinion, trading false breakouts is actually less risky than trading traditional breakouts. This is because so many people are watching for breakouts, but when the trade goes sour all those traders are clamoring for the exit; that provides a profit opportunity for the trader who held back and can now pounce on the opportunity. Here’s how to capitalize on false breakouts.
What Is a False Breakout?
First off let’s look at a normal breakout. A normal breakout is when the price breaks out of some pattern, whether it’s a range, triangle or some other chart pattern. By drawing lines along areas of support and resistance we can see where the priced had trouble passing through. If the price ends up passing through those prices, preferably in an aggressive fashion, then we have a breakout.
For more on breakout trading see: Improving the Odds When Trading Intra-Day Breakouts.
Traders watch for these of breakout moves, and attempt to capitalize on them. Figure 1 shows a breakout to the downside.
Figure 1. GBPY/JPY Downside Breakout
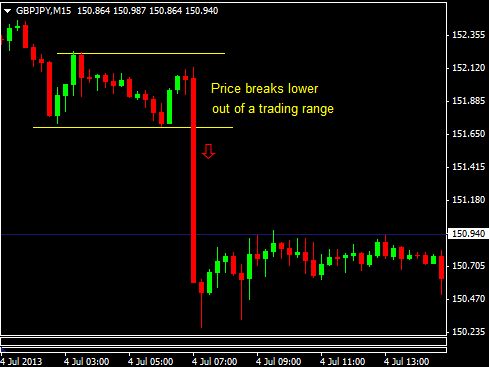
When the breakout occurs most traders will get short or buy puts. In this case the trade would have been profitable. If the breakout had been to upside, traders look to get long or buy calls.
Unfortunately, not all breakouts are as clear cut as the one shown above. Quite often the price moves out of a price range, appearing to be a breakout, but then quickly moves back into the range trapping all the traders trading the breakout.
Figure 2 shows a false breakout. It appears that the price is breaking to a new high (moving past the former high) which signals that the uptrend is continuing, and so traders start getting long/buying puts.
But the price quickly retreats back below the former high (yellow line) and continues to fall. In this case, trading the false breakout is the profitable strategy. Once you realize the move higher is a false breakout, you want to get short/buy puts.
Figure2. GBPY/JPY False Upside Breakout
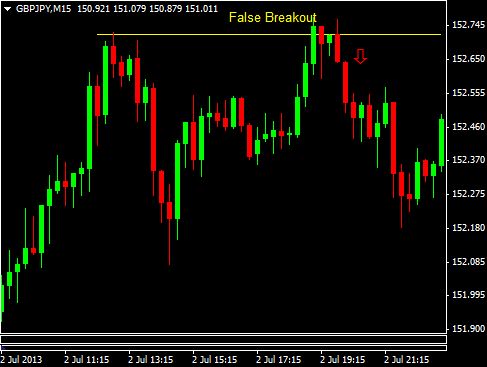
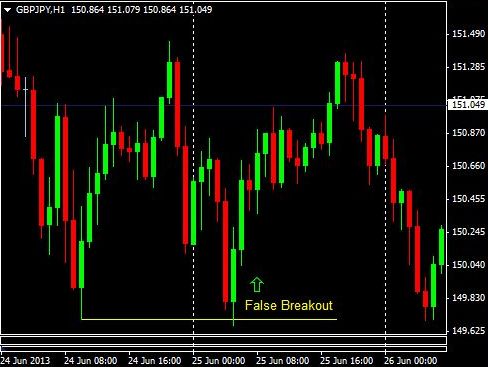
Figure 3 below shows a false downside breakout. The price moves just below a former low, but then quickly moves back higher, trapping the traders who thought the price would continue to drop. In this case, once you realize the downside breakout is false, you want to get long/buy calls.
Figure 3. False Downside Breakout
Trade With the False Breakout
Trading false breakouts provides another strategy that you can utilize, as well as offer a way to make back money you may have lost on the traditional breakout trade. Therefore, I like to trade breakouts, but also keep an eye out for false breakouts. If a breakout turns into a false breakout, I quickly close out my original (breakout) trade at a loss, or open a new position in the direction of the false breakout to offset losses on the original trade.
There isn’t a magic formula for trading false breakouts. Just like trading normal breakouts some of your trades will winners and some will be losers. By using a few other trading tactics though, you can potentially bolster your chances of success.
Confidence Boosters
One of the worst things that can happen to a trader is getting caught in a whip-saw, where they go from long to short, long to short and end up losing on all the trades because the market moves back and forth rapidly with no definitive direction. This can happen with breakout and false breakout trading.
To increase the odds of choosing which false breakouts to trade, using an indicator to two can help.
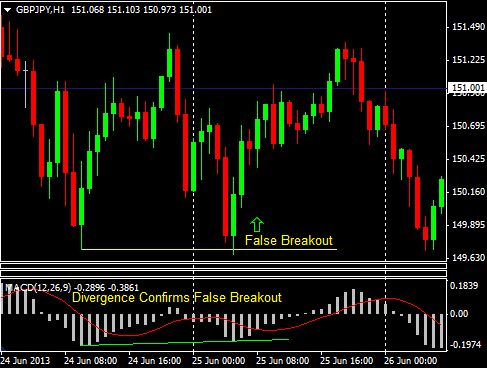
Add either a MACD or Stochastic Oscillator to your chart. In Figure 4 I’ve added a MACD to the trade we looked at in Figure 3.
On the false breakout, notice how the price has dropped below the former low (yellow horizontal line) but the MACD is actually above where it was (upward slanting green line). This is called a divergence; the indicator does not agree with the price action. In this case the indicator is warnings us that the falling price may soon give way to buying pressure, which it does.
Figure 4. MACD Confirms False Downside Breakout
In Figure 5 I have added a MACD to the trade we looked at Figure 2. Once again we see a strong divergence. The MACD is making a lower high even though price is making a higher high. The indicator is once again telling us that this breakout is very weak, and once the price begins to drop off the high we know that it is a false breakout.
Figure 5. MACD Confirms False Upside Breakout
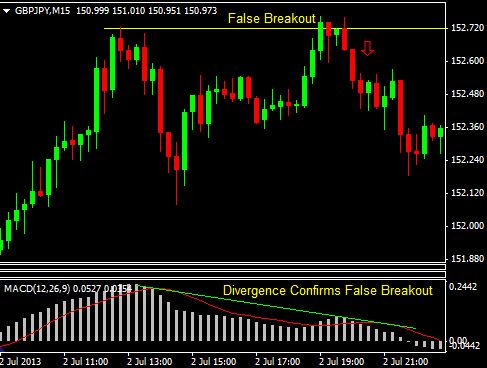
Adding the indicator helps in two primary ways. If you see this sort of divergence occur–where the indicator is not in agreeance with the price movement–it is likely best to skip the traditional breakout trade. Secondly, it signals that you should be on the lookout for a false breakout trade. When the false breakout develops, and you have a divergence, take a trade in the direction of the false breakout.
The Final Word
Trading false breakouts adds another element to your arsenal. Since most traders are looking to trade breakouts, when a false breakout occurs the move is often sharp as traders who use traditional breakout methods scramble for the exits. Just like you shouldn’t trade all breakouts, don’t trade all false breakouts either. Search out the ones that provide the best profit opportunity by looking for divergence on an indicator before making the trade.