How to Trade the New Highs or Lows Strategy
When I started trading almost a decade ago, this was one of the first basic strategies I used–buy on new highs or take short positions (buy puts) on new lows. It was incredibly simple and allowed me to establish my career as a trader. During that time there was lots of activity in the market, but as volatility dropped off this strategy didn’t seem to work as well. When markets are screaming higher or lower it is easy to make money using the strategy, but unfortunately markets aren’t always making big jumps which make it easy to hop on board to grad a few bucks. Therefore, in order to keep using the strategy I needed to find a way of determining how far, or for how long, the market was likely to run after making a new high or low. The following method can help pick better option expiry times and determine how far a move is likely to go.
The Basic Buy New High, Sell New Low Strategy
My preference is to always trade with the trend. Therefore, when the price of an asset is making new high after new high, I want to be going long (calls) and trading with the trend. When the price is making new low after new low, I want to get short (buy puts) to capitalize on that trend.
The strategy is to simply go long as the price creates a new high during an uptrend, or to get short (buy puts) as the price creates a new low during a downtrend. Figure 1 shows this in motion for an uptrend.
Figure 1. USD/CAD Hourly Chart – New Highs Marked
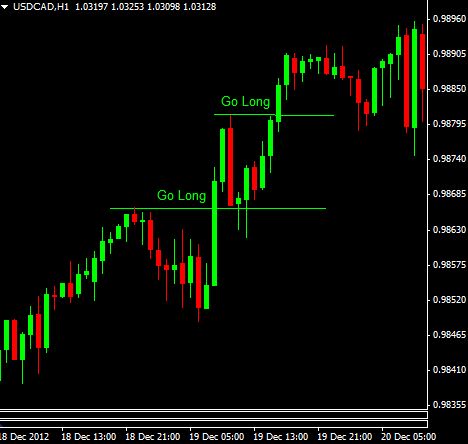
To use the strategy, simply draw horizontal lines extending out to the right based on recent highs. When the price passes through that line (old high) go long or buy calls. The problem though, is establishing how long the next move is going to last. In figure 1 we can see the price move to a new high, and we can establish a position, but that is only part of the trade. We also need to know how long our trade should last. In other words, if trading binary options you will need to determine what expiry to choose for the trade which gives you the best chance of finishing in the money.
Determining the Next Wave
Pullback Extrapolationis a method used to determine the magnitude of the next move, but also approximately how long it will last.
The technique is to measure the distance of the pullback prior to the breakout of a new high or low. If the breakout is to the upside (new high) add the distance of the pullback to the former high to get an estimate of how far the market may move. If the breakout is to downside (new low), subtract the distance of the pullback from the former low.
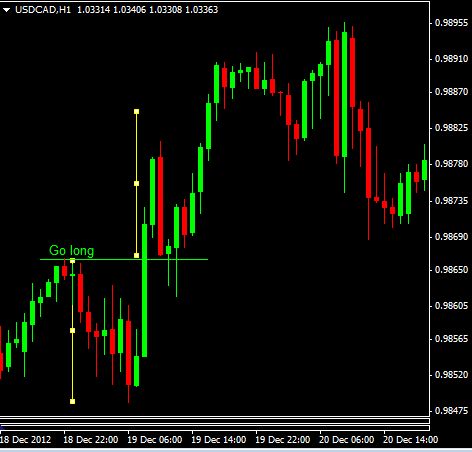
Figure 2 shows an example of a move to a new high. The yellow vertical line on the left shows the length of the pullback. I have duplicated that line and placed it above the new high to indicate where the move higher will potentially stop. In this the USD/CAD moved a bit higher than the estimate, which is ok.
Figure 2. USD/CAD Hourly Chart
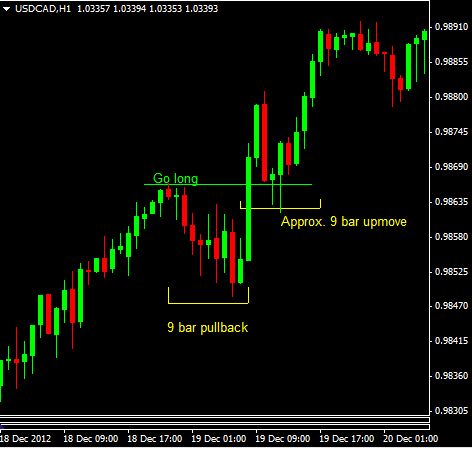
Instead of using the distance of the pullback, you can use time. In this case the pullback was 9 bars. I am only counting the bars that are moving counter-trend, or in this case, down. Therefore, you can expect that the next move higher should last approximately 9 bars, and therefore if trading binary options you’d choose a 9 hour expiry (as each bar in this chart is 1 hour). 9 hours later this trade was in the money as the USD/CAD was nearing the end of a bullish move. This method is shown in Figure 3.
Figure 3. USD/CAD Hourly Chart
Using the Technique
If you trade a breakout to a new high or low using binary options, use the number of periods in the pullback as the expiry, OR use one period. These expiries are likely to increase the odds of finishing in the money. The one period expiry can also be used because it quite rare to have a breakout followed almost immediately by a reversal; usually at least one bar is in the money before the reversal. The periods are based on the chart time frame you use, such as 1, 5, 15 minute or hourly charts.
While I have used hourly charts in the examples, the method works charts with all time frames.
If there is no significant pullback before the move to new high, the method is unlikely to be reliable. As in the examples, a pullback that is visible and measureable is preferred.
A very brief pullback against the trend shows the trend is quite strong, and therefore the next move is likely to be larger than the pullback. Therefore, if a pullback is only two or three bars, and then the trend resumes (by making a new higher high or lower low) the next move is likely to last more than two or three bars respectively.
No trading method is flawless. This method is simply used to provide an approximation of how long a move will last, or how far the move will travel. When used correctly it can increase the odds of finishing in the money, but markets are dynamic and won’t always move in accordance with this strategy.
Final Word
The buying new highs and selling new lows strategy is one of the simplest around, and it can be profitable if the right exit or option expiry is chosen. Use the pullback that occurs before a new high or low as a guide to how big and how long the next move will be. Then use this information to choose an expiry time or exit that works for that particular time frame and trade. Also, make sure you’re trading in the direction of a strong trend. By trading with the trend you stand a greater chance of finishing in the money. Go through your charts and see how the method would have worked in the past, and get a feel for the strategy before risking real capital.