Cryptocurrency Forecast; Golden Cross Confirmed, Outlook Bullish
Golden Cross, It’s A Bullish Signal
I just saw an article about Bitcoin touting it’s Golden Cross. I went straight to the charts to see what was going on and had a hard time understanding what all the fuss was about. Bitcoin’s last moving average signal on the weekly chart was a Gold Cross, sure, but that happened 8 months ago. That signal did result in a vigorous rally but it’s played out. What’s Bitcoin doing for me now, other than trending steadily lower in spite of the bullish outlook?
Before I go on, let me explain exactly what this Golden Cross is, or was, how it is made up is what I mean. This Golden Cross in question occurred on the weekly chart early this spring, 2019. The shorter-term 50-period EMA moved below the longer-term 100-period moving average what as then called a Death Cross in the headlines. After a few weeks of sideways action the shorter-term EMA, in tandem with the market, moved above the longer-term EMA creating the Golden Cross.
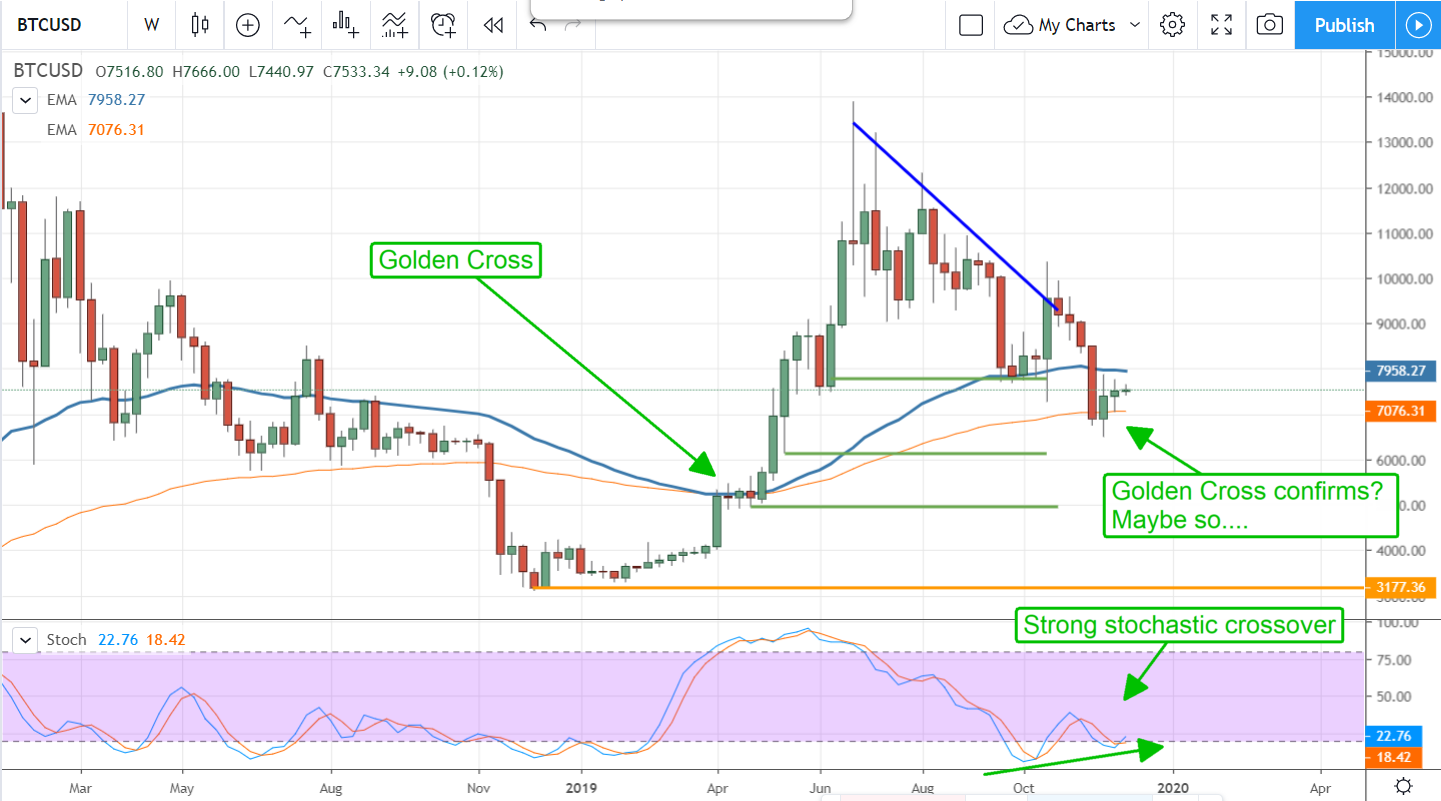
So, Bitcoin moved up on the Golden Cross signal, hit a peak, and retraced more than 50% of the rally.
The world’s leading cryptocurrency is now bouncing off of the same, 100-period long-term moving average that provided the signal in the first place.
As a point of support it is usually a strong technical level, the 100-period moving average, so prices are likely to rise in the near-term. While not a Golden Cross, the bounce from the EMA is a potentially bullish signal we need to pay attention to.
A confirmed bounce from the long-term EMA would in fact confirm the shift in trend signaled by the original Golden Cross. In that light such a bounce could be strong and large. Traders need to be ready. When this thing starts moving we could see prices rally back to the 2019 highs in a matter of weeks.
The stochastic is working in Bitcoin’s favor. The oscillator is firing a strongly bullish crossover at this level and one I expect will result in higher prices for Bitcoin. The strong bullish crossover happens when stochastic diverges from the price action while the asset is testing support. When coupled with other technical buy signals like moving average crossovers, RSI or other signals big moves usually follow. The questions now are how will it go and how long will it stay there.?
If the $8000 level is not surpassed the downtrend in prices is likely to continue. If prices fall again, the long-term moving average is still the first target for support. A drop below that could take BTC/USD down to $6000 before it bounces again. If BTC/USD is able to move above the $8000 level its price may begin to gain momentum. If that happens the $9,000 and $10,000 levels are the most likely targets for the next resistance. Those could be hit in single trading sessions if the timing is right, $1000-day moves are common with Bitcoin.