Crypto Whales Stir the Waters, Making a $1.3 Billion Splash
Is The ETF Craze Drying Out?
It looks like the whales are waking up and feeling hungry again. Is it time to prepare for another Bitcoin surge, or maybe we are looking too much into this stuff?
In a massive move, whale accounts, dropped $1.3 billion in USD Coin to Coinbase last Thursday. This eye-catching transaction, split into five hefty chunks ranging from $150 million to $350 million, typically sets the stage for some excitement: most pundits would say this is a “thumbs up” for upcoming substantial buys of Bitcoin and Ether.
Now, while loading up exchanges with stablecoins often hints at bullish behavior, moving large volumes of cryptocurrencies to off-exchange wallets can send a different signal altogether, sparking fears of a possible selloff. But always keep in mind that these big moves don’t always predict market swings with absolute certainty – nothing ever does.
Adding to the intrigue, BlackRock’s IBIT, the spot Bitcoin ETF that’s been a darling on Nasdaq since January 11, just saw its first drop in popularity—ending a 71-day streak of investment inflows. This shift reflects a broader cooling off because IBIT is not the only Exchange Traded Fund that’s been slowing down. The other BTC ETFs are going through similar experiences.
Bitcoin itself has been bobbing between $60,000 and $70,000 in April, showing signs that it could be in for a bumpy ride, especially considering the recent halving and global markets jittery over tensions in the Middle East.
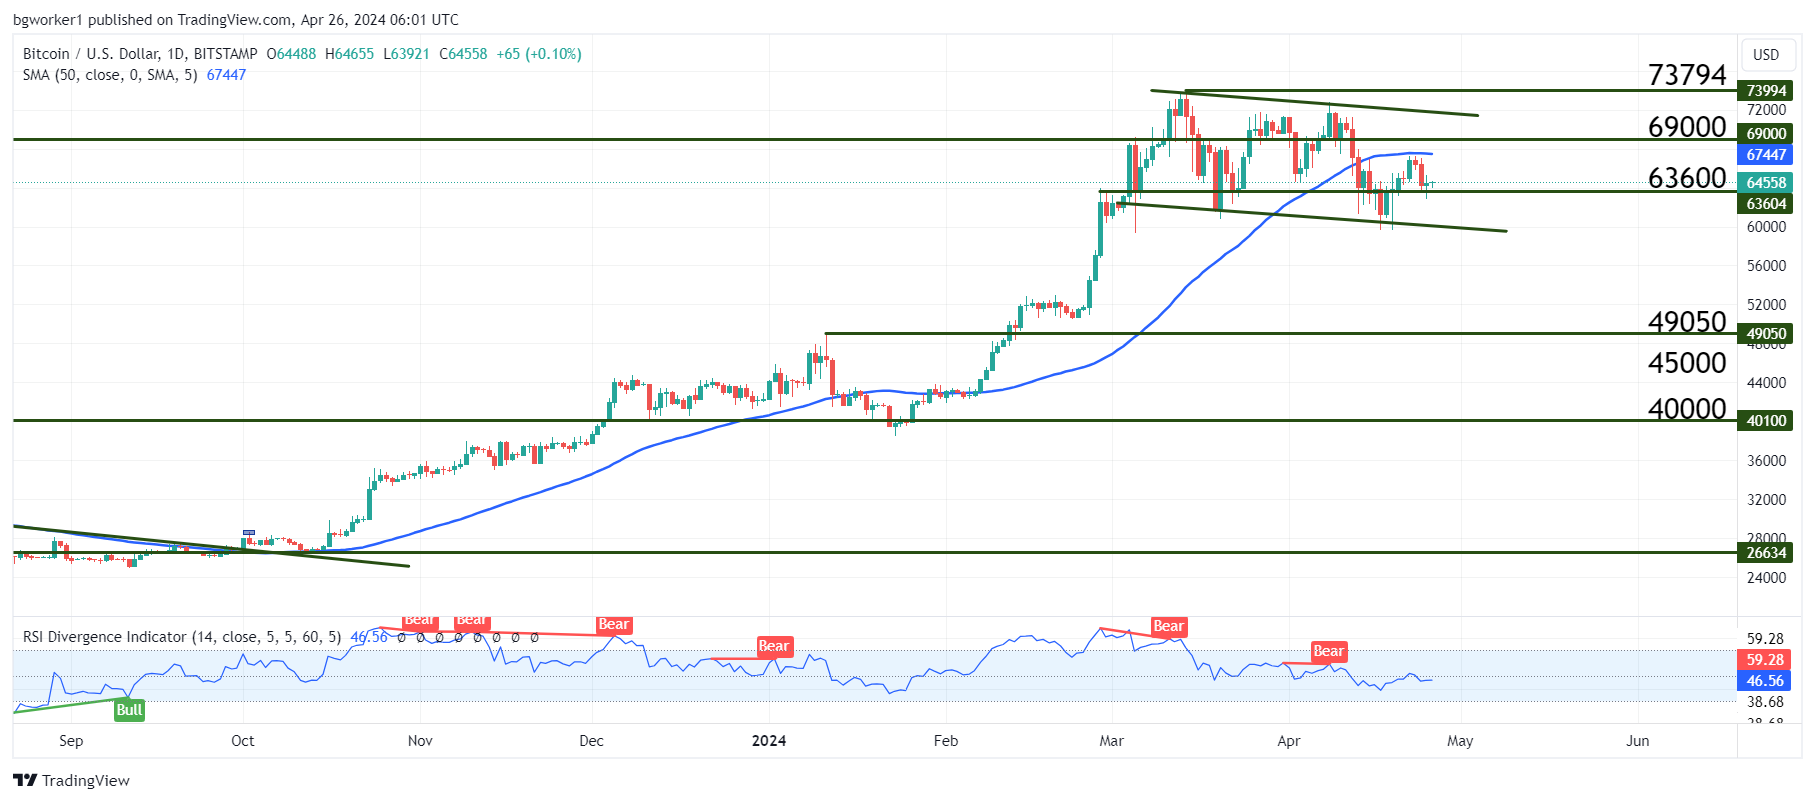
Chart Analysis – BTC/USD
Bitcoin is currently trading at $64,400, which is almost the same price it was trading 7 days ago. April’s low was $59,600 and the high was $72,750, so, there’s definitely been some volatility this month but we may witness the start of a slower period.
The pair is trapped between several support and resistance zones, namely the $63,600 support, and the 50-day Moving Average, and is inside the descending channel seen on the chart below. Then, we have the psychological levels like $60, 000, $65,000, and $70,000, which could all trigger stronger moves if they are broken.
If the current support ($63,600) holds, we may see a break above the 50-day MA, which would bring in additional buyers. However, $63,600 is not a major support (at least not on the daily chart), so we could see an easy break and a consequent move towards the bottom of the descending channel.