Counter-Trend Traders, Rejoice: EUR/USD Triple Bottom in Place
Bullish Pattern Emerges. Long-Term EUR/USD Downtrend Threatened.
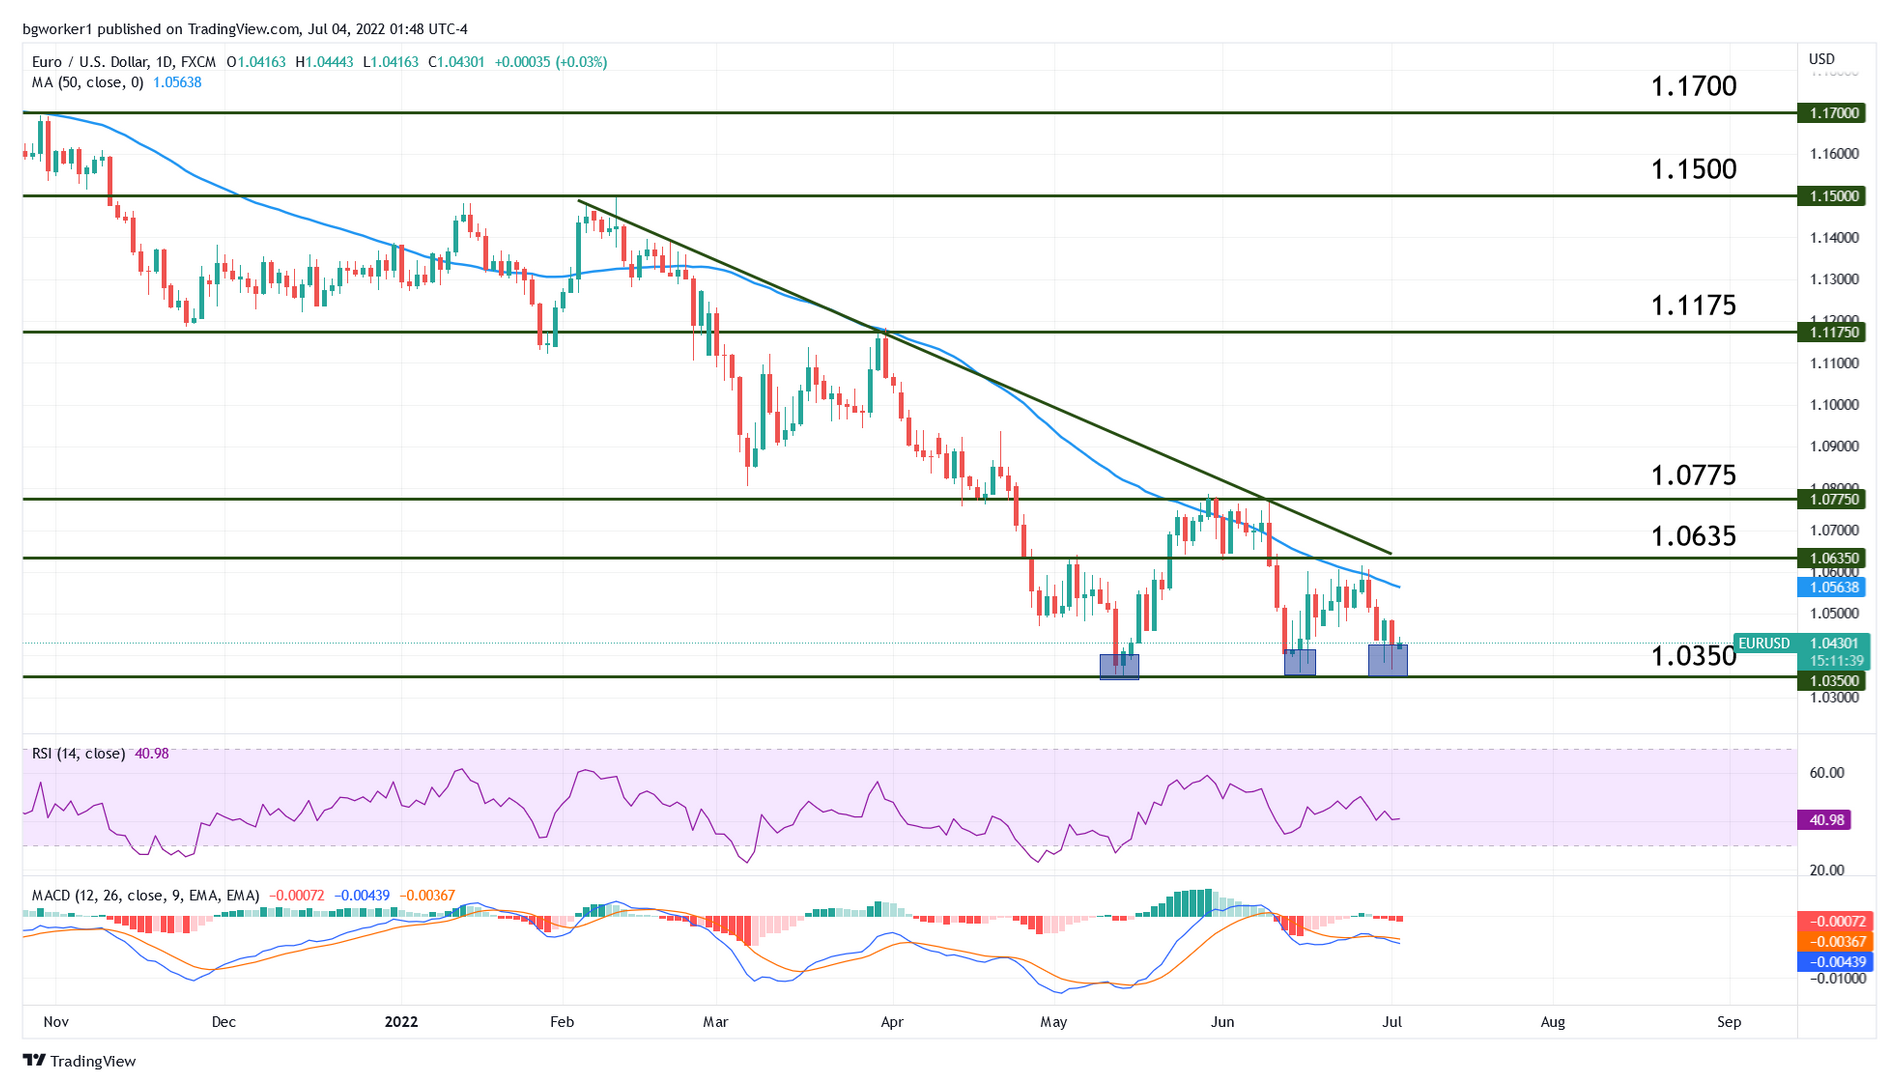
On May 13, the dollar managed to take the euro to 1.0350 for the first time since December 2016. After a bounce that took the pair back into the 1.0770 area, the bears tested 1.0350 two more times, creating a triple bottom pattern. This is viewed as a bullish pattern, a sign that support is holding and that a bottom may be in place.
Although the main trend is still bearish and from a long-term perspective the pair is still on a downward path, this triple bottom setup is appealing, especially for “counter-trend” traders and reversal strategies.
Key Data for the Week Ahead
The United States celebrates Independence Day on July 4th, which means that banks will be closed and no data will be released. Volatility for USD pairs may be affected.
The first highlight of the week comes Wednesday in the form of the FOMC Meeting Minutes, scheduled for Wednesday at 6:00 pm GMT. This is a detailed record of the latest FOMC rate Meeting, which offers in-depth details into the reasons that determined the rate vote. More importantly, the document may contain clues about the pace of future hikes and that’s where its importance comes from.
Thursday at 12:15 pm GMT we take a look at the ADP Non-Farm Employment Change, which shows changes in the number of employed people during the previous month, excluding the farming industry and government. It is less important than the NFP report that comes out a day later, but it can have a notable impact on the US Dollar.
The main event of the week will be the Non-Farm Employment Report (Non-Farm Payrolls) that comes out Friday, July 8 at 12:30 pm GMT. It shows changes in the number of employed people, excluding the farming industry, and is widely regarded as the most important jobs data for the U.S. economy. The expected change is 275K, lower than last month’s 390K.
Technical Outlook – EUR/USD
At the time of writing, the pair is trading at 1.0430 and the biggest takeaway is that price action has carved a triple bottom at 1.0350. Although the last attempt only made it to 1.0365, the pattern can still be considered a triple bottom.
The Relative Strength Index is showing bullish divergence in the sense that it is printing higher lows while the price is making a triple bottom. This is not the strongest divergence but it is still a notable bullish signal.
All signs point towards a relief rally that will likely see the pair move higher, possibly into the 50-day Moving Average but a break of 1.0350 would invalidate this scenario and would also show bearish pressure.