BTC Price Resilience Amid Jobs Data & Whale Surge
BTC/USD Consolidation, Potential Reversal Ahead.
The recent jobs and services data released throughout the week sent Bitcoin briefly below its $30,000 threshold but a swift recovery soon followed. At the time of writing the Digital Gold is trading just above this support, at $30,250, after reaching a low of $29,720.
ADP’s No-Farm Employment Change report blew the expectations out of the water, with a 492K actual, while the forecast was a mere 226K and the previous number was 267K. The ADP (Automatic Data Processing, Inc.) report tries to mimic the government-issued Non-Farm Payrolls report which is due later today, at 12:30 pm GMT. The ADP data excludes the farming industry and the government from the calculation.
If the ADP report is any indication, then the NFP will probably surpass expectations, strengthening the US Dollar and possibly sending BTC/USD lower. Last month’s NFP reading was 339K and the expected number is now 224K.
Bitcoin Whales Number Swells
Recent data from crypto analytics firm Glassnode, showed that the number of Bitcoin whales has increased. Despite this, the volume of Bitcoin transferred to exchanges is on a decline, which may suggest that the bullish sentiment is growing.
The term “whale” in the context of Bitcoin refers to individuals or entities that hold a significant amount of BTC. However, there is no specific threshold that defines exactly how much BTC one must hold to be considered a whale. The classification of a whale can vary depending on the context and the perspective of different observers.
Usually, whales send their crypto possessions to an exchange with the goal of selling. That’s why a massive influx of whale funds into exchanges is considered bearish. On the other hand, if the whales keep their digital assets in cold wallets (or any other form of storage outside an exchange), it’s an indication that they are not willing to sell at the current price. Not being willing to sell could mean they expect the price to increase.
Chart Analysis – BTC/USD
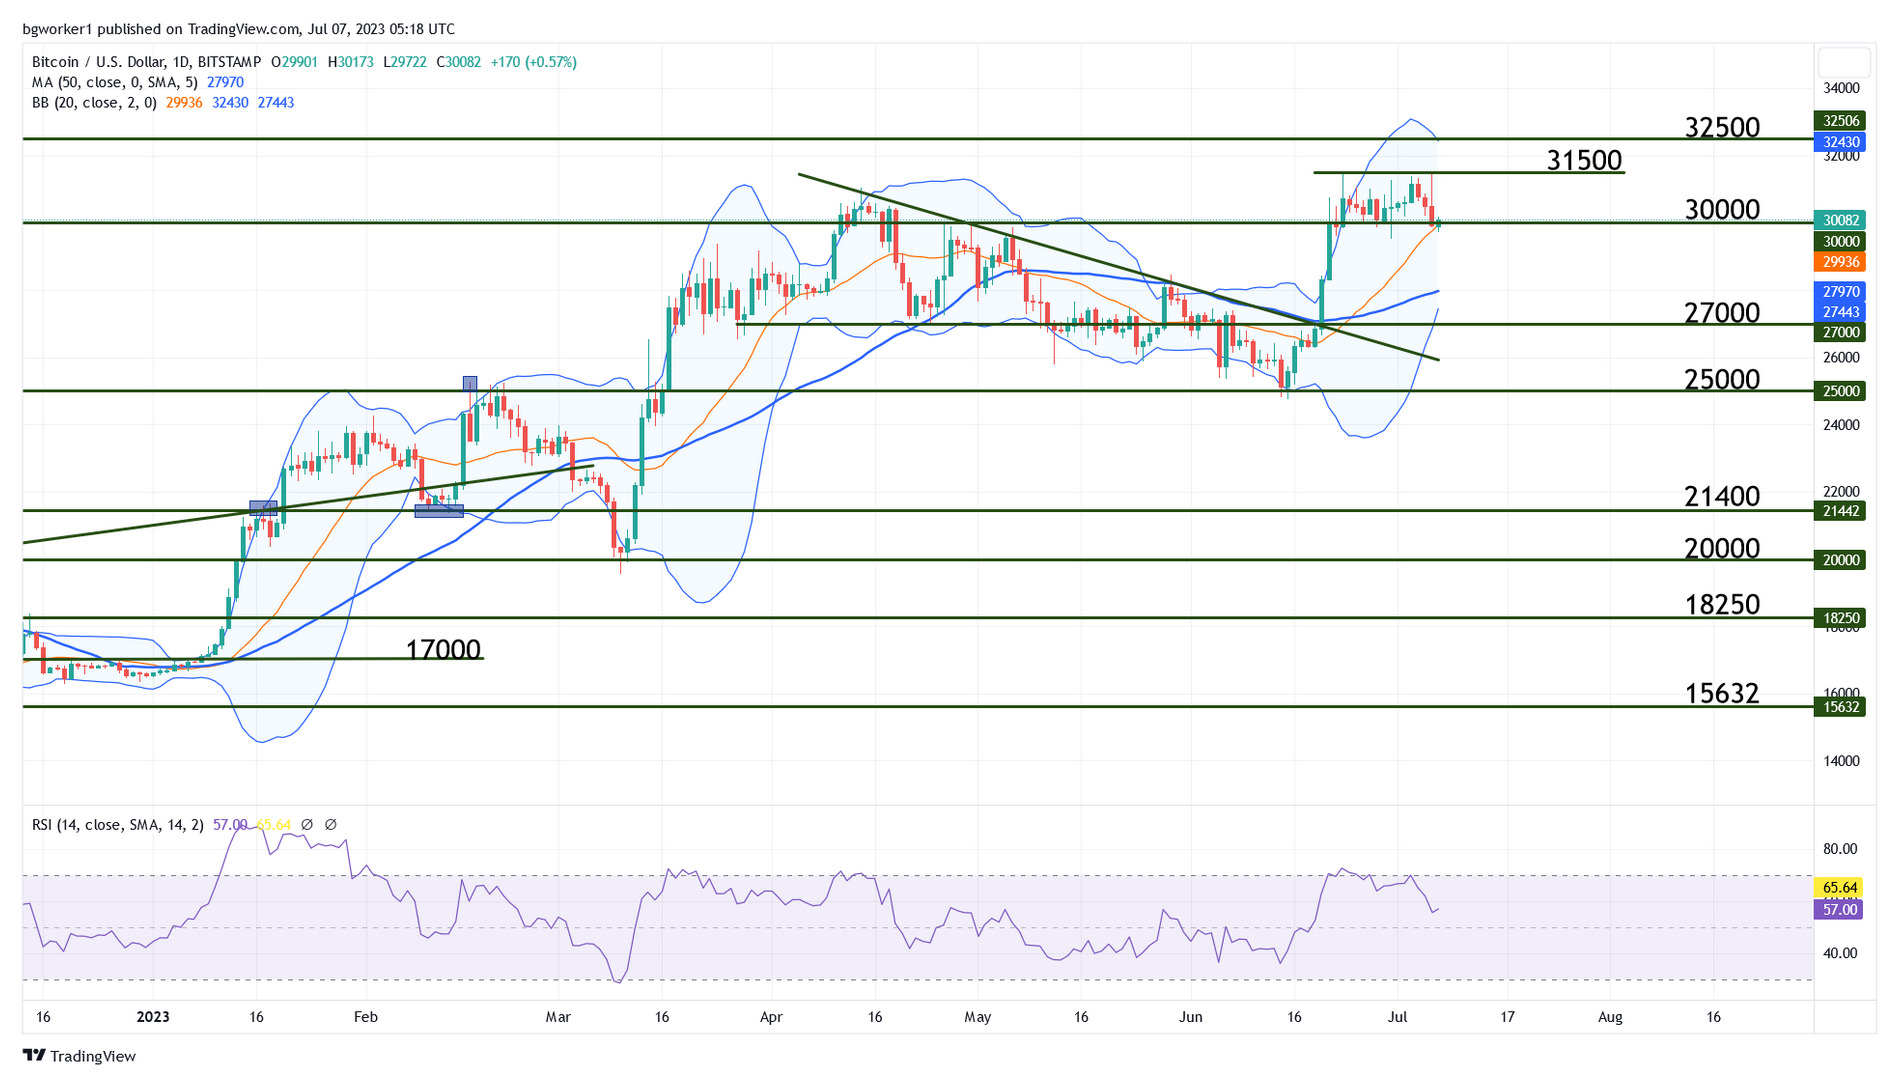
Bitcoin surpassed $30K and then consolidated above it, bouncing its head several times on the $31,500 threshold. It failed to surpass $31,500 and then dropped to just below $30K. It has since moved back above $30K, albeit by a short margin. It is trading at $30,150 at the time of writing.
On the technical side, the price is above the 50-day Moving Average, which suggests a positive trend, but it is also at the middle line of the Bollinger Bands, which indicates a period of consolidation. If the pair moves through this line, we may see a touch of the lower Bollinger Band.
There are some bearish signals to consider. The RSI (Relative Strength Index) has touched its 70 level (considered overbought) twice, indicating potential exhaustion in the buying momentum. Also, there is bearish divergence between the price, which is making a double top (at $31,500), and the RSI, which is making lower highs. This could indicate a potential reversal or a slowdown in the bullish trend.
Don’t forget that the Non-Farm Payrolls (NFP) report is yet to be released, and it could have an impact on the price action of BTC/USD.