Bitcoin’s Bumpy 2024: A Tale of ETFs, Halving and Inflation
Bitcoin Cash Completes its Halving. Bitcoin’s Countdown Has Started!
Welcome to the whirlwind that is Bitcoin in 2024! The price of Bitcoin dropped below $65,000 this week; to put things in perspective, on Monday it was trading above $71,000. Between mid-February and mid-March, Bitcoin saw its biggest climb, thanks to spot ETFs (Exchange-Traded Funds) aggressively buying up Bitcoin, and despite Grayscale’s Bitcoin Trust (GBTC) selling off their stash. However, the momentum shifted as ETF buying slowed and GBTC continued its sales, leading to days when more Bitcoin was sold than bought.
In this backdrop, Bitcoin’s price took a more than 10% dip from its high of nearly $74,000 in March. Why? Let’s look at the bigger picture. Many hoped for a softer monetary policy from the Federal Reserve to boost Bitcoin further. But economic indicators had other plans. Inflation ticked up to 3.2% in February, staying well above the Fed’s 2% goal. The job market, however, showed resilience with robust growth, with the NFP constantly overshooting expectations by a wide margin.
On Wednesday, the ADP Non-Farm Employment Change report showed that 184K new jobs were created, which was more than the predicted 148K. The government-issued Non-Farm Payrolls report is yet to be released later today, and it will certainly stir up some USD movement, so we can expect an impact on Bitcoin as well.
In the meantime, the Bitcoin halving countdown has started and will probably continue to add to the choppiness that seems to have taken hold of Bitcoin lately. Bitcoin Cash has just completed its own halving event and it experienced increased volatility. It dropped about 10%, to around $570 on the day before the halving but it is currently trading at $695, for more than 21.50% added in the last 7 days.
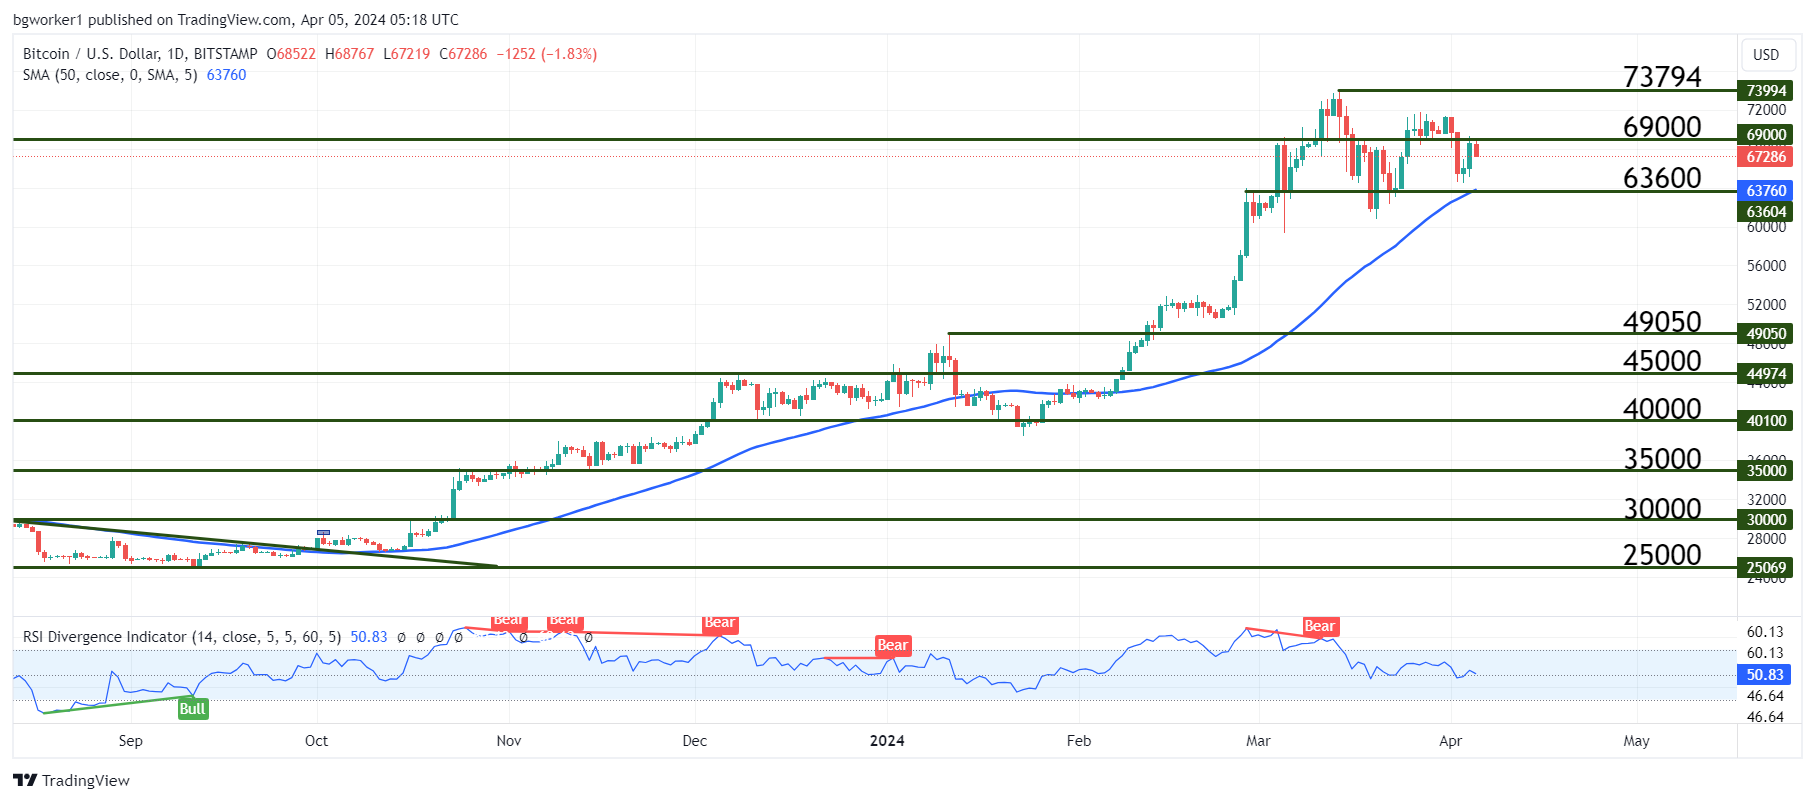
Chart Analysis – BTC/USD
At the moment, we can see two significant peaks. The first one is the All-Time High at $73,794 and the second one is $71,600. The latest price action has established 71,600 as resistance, but it is also the first lower high in a long while.
Bitcoin bulls failed to challenge the ATH after breaking $69,000 and instead, this S/R was broken to the downside, which shows that bullish pressure is starting to fade. Also, Bitcoin just retested $69,000 and bounced lower, which means this level is resistance once again.
On the other hand, we could also consider that the price made a higher low (current low compared to the low made on March 20), so the picture is blurry.
It will be interesting to see how Bitcoin behaves once (or if) it hits the support at $63,600, which also coincides with the 50-day Moving Average. This confluence zone could be the point where more bulls decide to enter their long positions. Let’s not forget the NFP release later in the day, which will likely have an effect on BTC/USD.