BTC’s Surge May Be Far from Over. ETFs Boom, Whales Dive In
Previous ATH Broken: Will the Bulls Take Notice?
This month we experienced the freshest All Time High at $73,794, which is a great feat considering that we are just three months into 2024 and Bitcoin’s low was below $40,000. In three months, the digital king appreciated by more than $33K and we are yet to see the full effects of the halving that is upon us in approximately 24 days.
After the March 14 ATH, Bitcoin dropped to a low at $60,760 but it is currently trading around $70,200, just above the support at $69,000 (which was the previous All Time High). This pullback was seen by many whales as a good opportunity to accumulate more Bitcoin. And accumulate they did!
During the last week, Bitcoin whales have bought over 100,000 BTC, signalling a very strong conviction that they expect the price to start moving up. This aggressive buying, valued at over $7 billion shows trust in Bitcoin’s long term ability to sustain a high price and possibly to break the most recent ATH.
The sentiment seems to reverberate through the Bitcoin ETF space, as BlackRock CEO Larry Fink said he has been “pleasantly surprised” by the performance of the company’s spot BTC ETF. He also stated he is “very bullish” on the long term sustainability of Bitcoin.
On a similar note, Cathie Wood’s ARK 21Shares Bitcoin ETF scored a record $201.8 million inflows on Wednesday. The average daily inflow since the launch on January 11 was $43.9 million. All clues point towards an increased interest in Bitcoin products, with the ETFs leading the charge. Let’s see how this will affect Bitcoin’s price going forward.
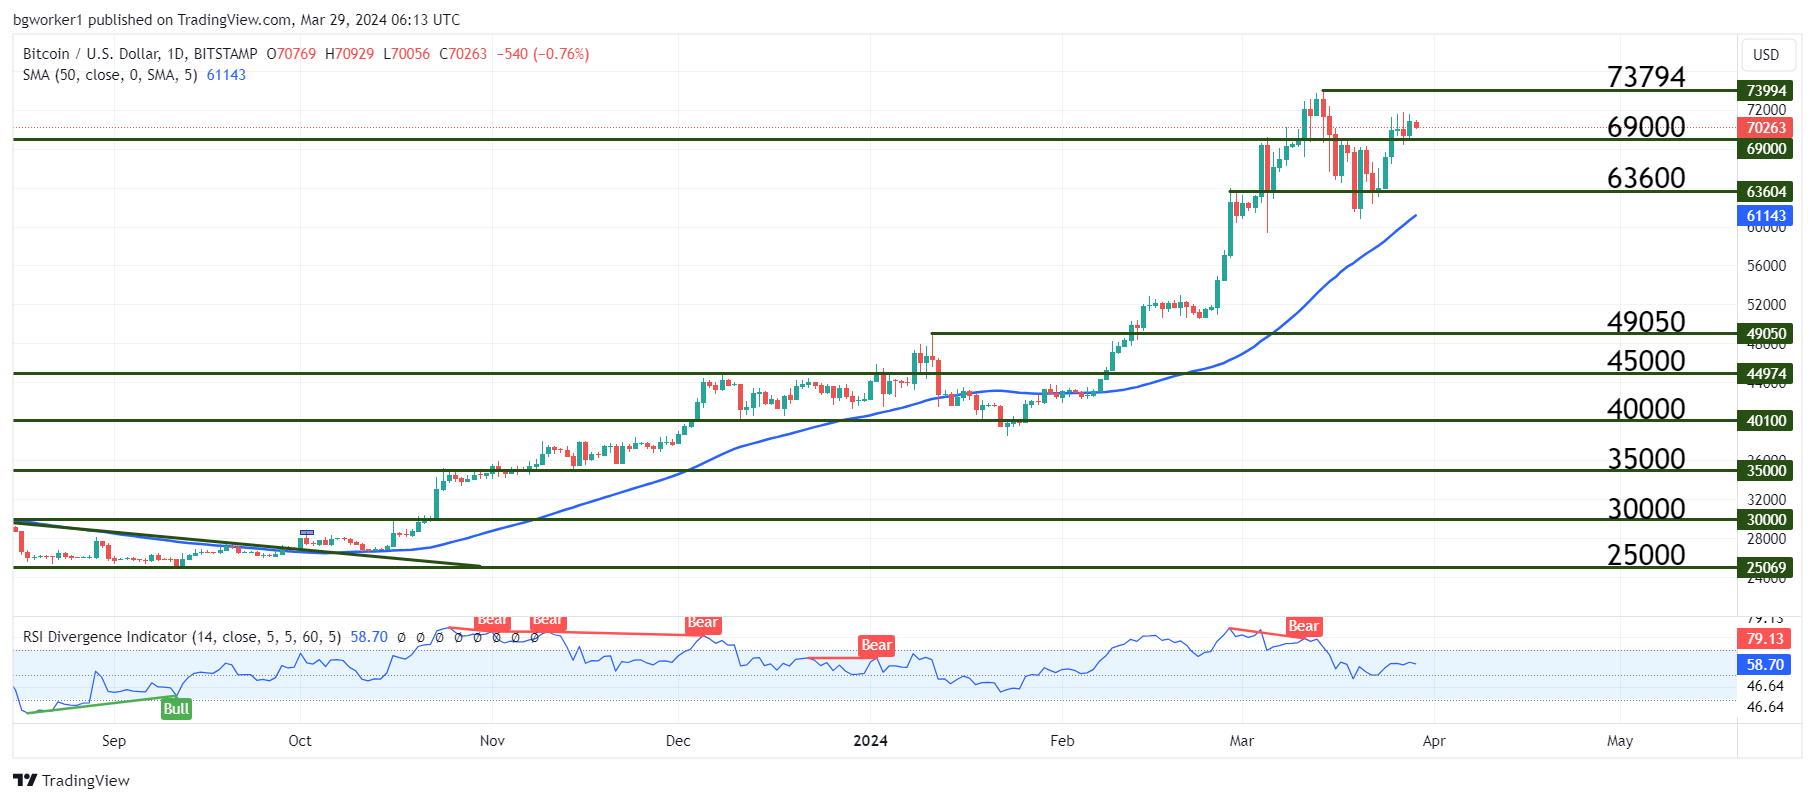
Chart Analysis – BTC/USD
Bitcoin is currently up 5.40% in 7 days, according to data from CoinMarketCap. Just as the pair broke through $69,000, two indecision candles appeared. The top of these candles is a point of interest because a break would signify that the bulls have enough steam to challenge the $73,000 zone.
On the other hand, if Bitcoin drops below $69,000, we may see an extended period of range-bound trading inside the $73,000 – $63,000 channel. The Relative Strength Index (RSI) bounced twice at its 50 level and is now heading north, which is a bullish sign.
The 50-day Moving Average is pointing up and the market sentiment is positive, with investors accumulating large positions and ETFs going strong. All signs point towards higher prices, but this doesn’t mean that Bitcoin will only head north as its volatility can quickly reverse all moves.