BTC/USD tests the 200-day moving average as RSI approaches oversold territory.
Bitcoin bulls are struggling to put together a recovery amid concerns over US inflation and a heightened probability of another rate hike in December. Spot Bitcoin Exchange-Traded Funds (ETFs) have been posting constant outflows, adding to the cryptocurrency’s weakness. According to data from Coinglass, BTC ETFs saw inflows of over $1.87 billion from the start of November, with only one day of inflows.
Earlier in the week, the Consumer Price Index (CPI) showed elevated inflation in the US and sent the odds of a 25 bps rate hike to 92.5%, according to the CME FedWatch tool. This strengthened the US Dollar and diminished demand for risky assets such as cryptocurrencies. Bitcoin’s recent drop was also fuelled by jitters triggered by the Democrats’ midterm election victory. The initial reaction of the crypto market was rather bullish, as a Democrat victory had been almost fully priced in.
However, several Democrats have made their crypto skepticism known, while also calling for tighter regulation. Senator Elizabeth Warren is expected to lead the Senate Banking Committee, which would grant her substantial authority over the US financial markets. She has been one of the most vocal critics of cryptocurrencies among Senate Democrats, so if she were to take the reins of the Senate Banking Committee, this could put further pressure on the crypto market.
Chart analysis – BTC/USD
Bitcoin is now testing the 200-day Moving Average (red line on the chart) and a break could spell disaster for the bulls. The 200 MA was initially breached to the upside during the August rally, and it looked like Bitcoin would continue to fly. But after topping out at $87,000, BTC retreated to the MA, and nullified almost half of the August – September rally.
The Relative Strength Index (RSI) is approaching oversold on the Daily chart, and a bullish trend line sits just below the 200 MA. These forms of support (the moving average, the trend line, and the RSI approaching oversold) may trigger a relief rally, but for a more sustained recovery, Bitcoin would need to move above the $75,000 level (it is trading around $73,000 at the time of writing).
Psychological support sits at $70,000, and technical support is located at $67,000. If the bulls fail to defend the 200-day Moving Average and the trend line, these levels could be on the bears’ agenda next.
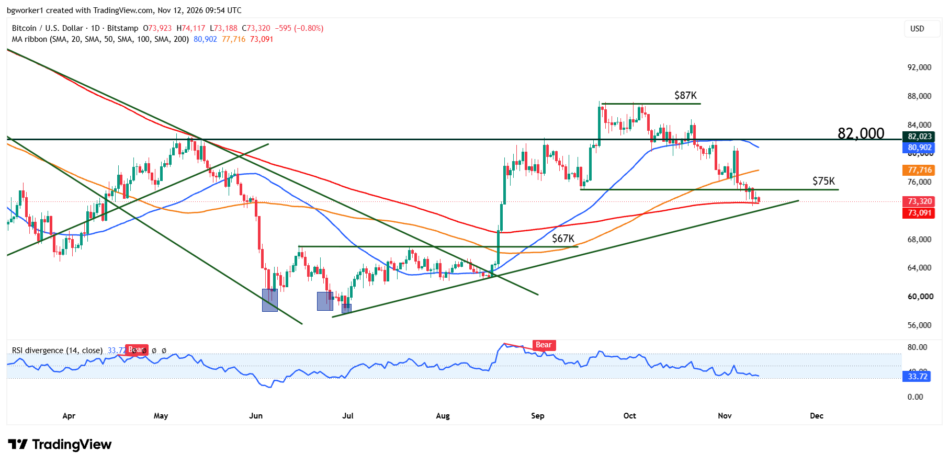
Bitcoin tests its 200-day moving average as selling pressure mounts. A breakdown could expose $70,000 and $67,000, while a recovery above $75,000 would improve the bullish outlook.