Bitcoin Resilient Amid Inflation and Rate Concerns
BTC/USD Analysis: From $25,000 Bounces to Crucial Moving Averages
Bitcoin’s price saw a decline for a 5th consecutive day on Thursday, following the U.S. inflation report which revealed that the monthly CPI increased 0.4% while yearly inflation rose 3.7%. The forecast was 0.3% and 3.6%, respectively.
Inflation data sparked speculation regarding the Fed’s next move. Markets are pricing in a 40% chance that the Fed will hike in December (versus just 28% before the CPI came out). As for the November meeting, the probabilities stand at 90.3% for “no change” and 9.7% for a hike.
Although it is currently moving lower, Bitcoin fares much better than Ethereum and other altcoins. The second-largest cryptocurrency by market cap is facing a 7-month low and has lost almost 5% in the last 7 days and -1.40% over the last 24 hours. On the other hand, Bitcoin is down just 2.60% over the last 7 days and 0.10% in the last 24 hours.
The biggest loser among the Top 10 is Solana (SOL), which lost 7.99% in the last 7 days and 2.73% in the last 24 hours. A close second is Ripple’s XRP, with a -7.65% loss in 7 days.
Bitcoin’s relative resilience might stem from its recognized appeal to investors and its perceived status as a hedge against inflation. If the U.S. economy is hit by a recession, the US Dollar will collapse, which may benefit the owners of Bitcoin. Alongside this, we have all the recent accumulation from major financial powerhouses and the race to list the first Spot Bitcoin ETF. When or if the spot ETF is approved by the SEC, the apex cryptocurrency will likely swell but the mighty dollar may have a thing or two to say.
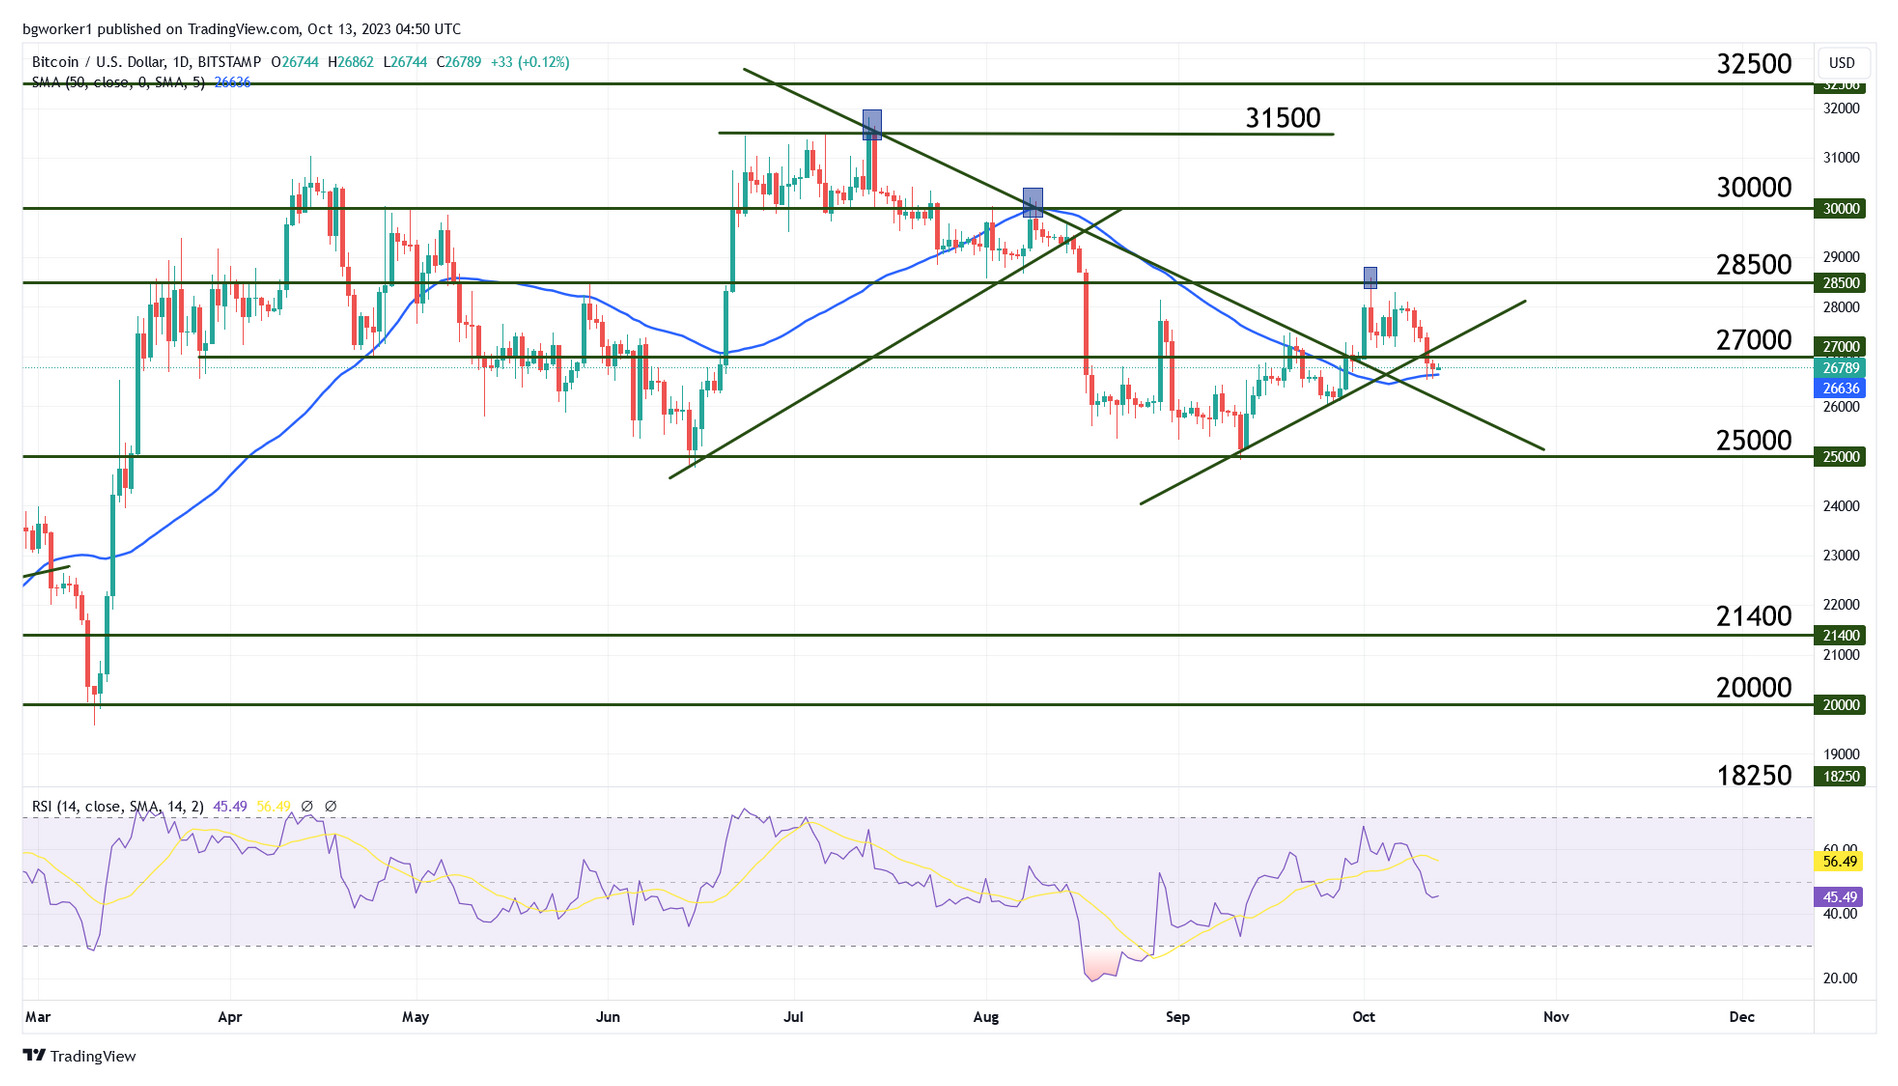
Chart Analysis – BTC/USD
Bitcoin is in a tricky place right now. On the one hand, it broke the support at $27,000 and the bullish trend line, and on the other hand, it is showing signs of bouncing at the 50-day Moving Average. Also, after the bounce at $25,000, the pair showed constant higher highs and higher lows. If this trend continues, the next destination is a higher high. Yet, there’s a caveat:
After touching $28,500 earlier in the month on 02 October, the bulls made another attempt to surpass that level on 06 October. But they only peaked at $28,300. Could this second attempt be considered a lower high? If so, bearish momentum might dominate for an extended period.
If BTC/USD falls beneath the 50-day Moving Average, the odds of a substantial downturn grow. This is because the 50-day MA is the last remaining support in the confluence zone, previously bolstered by the bullish trend line and the $27K support.