Bitcoin Ends 2025 in the Red. Is the 4-year Cycle Dead?
BTC Stuck in Compression Pattern, With Flat Price Action. Breakouts Expected
Historically, the next year after the Bitcoin halving is bullish, and after a major peak, the market enters a bearish phase. The halving occurs every 4 years, with the last event being in 2024, which means that 2025 should have been a bullish year. But 2025 marks the first time that Bitcoin has fallen after a halving year.
The current All-Time High (ATH) was indeed achieved in 2025, but immediately after that high was reached, BTC started to fall off sharply, resulting in a bearish yearly candle with a very small body and long wicks, especially in its upper part. Some of the losses were erased by year’s end, but the candle was red nonetheless.
So, we did have a rally and an ATH after the halving, but the year itself ended in the red. The cycle is breaking down but not completely. On one hand, 2025 should have been a bull year that ended with a green candle – this did not happen, and it indicates that the cycle is over. On the other hand, 2025 did produce an ATH, and this supports the idea that the cycle is still in effect.
The New Bitcoin
The 2012, 2016, and 2020 halvings were all followed by bullish years (green candles), aligning with the 4-year cycle narrative. 2025 is the first red year after a halving. But we have to take into consideration that Bitcoin is not the same as it was in 2012 or even 2020. Now we have institutional adoption, corporate treasuries, and balance sheets, which do not behave like FOMO and FUD-driven retail traders.
Bitcoin went from a joke in the eyes of the ‘big boys’ to a hot asset that is at the forefront of the reshaping of the financial world. After outgrowing the “joke” status, it was viewed somewhat as a threat to the status quo. Now it’s viewed as a valuable asset, with serious profit potential, and it is sought after by the biggest corporations in the world. Welcome to 2026!
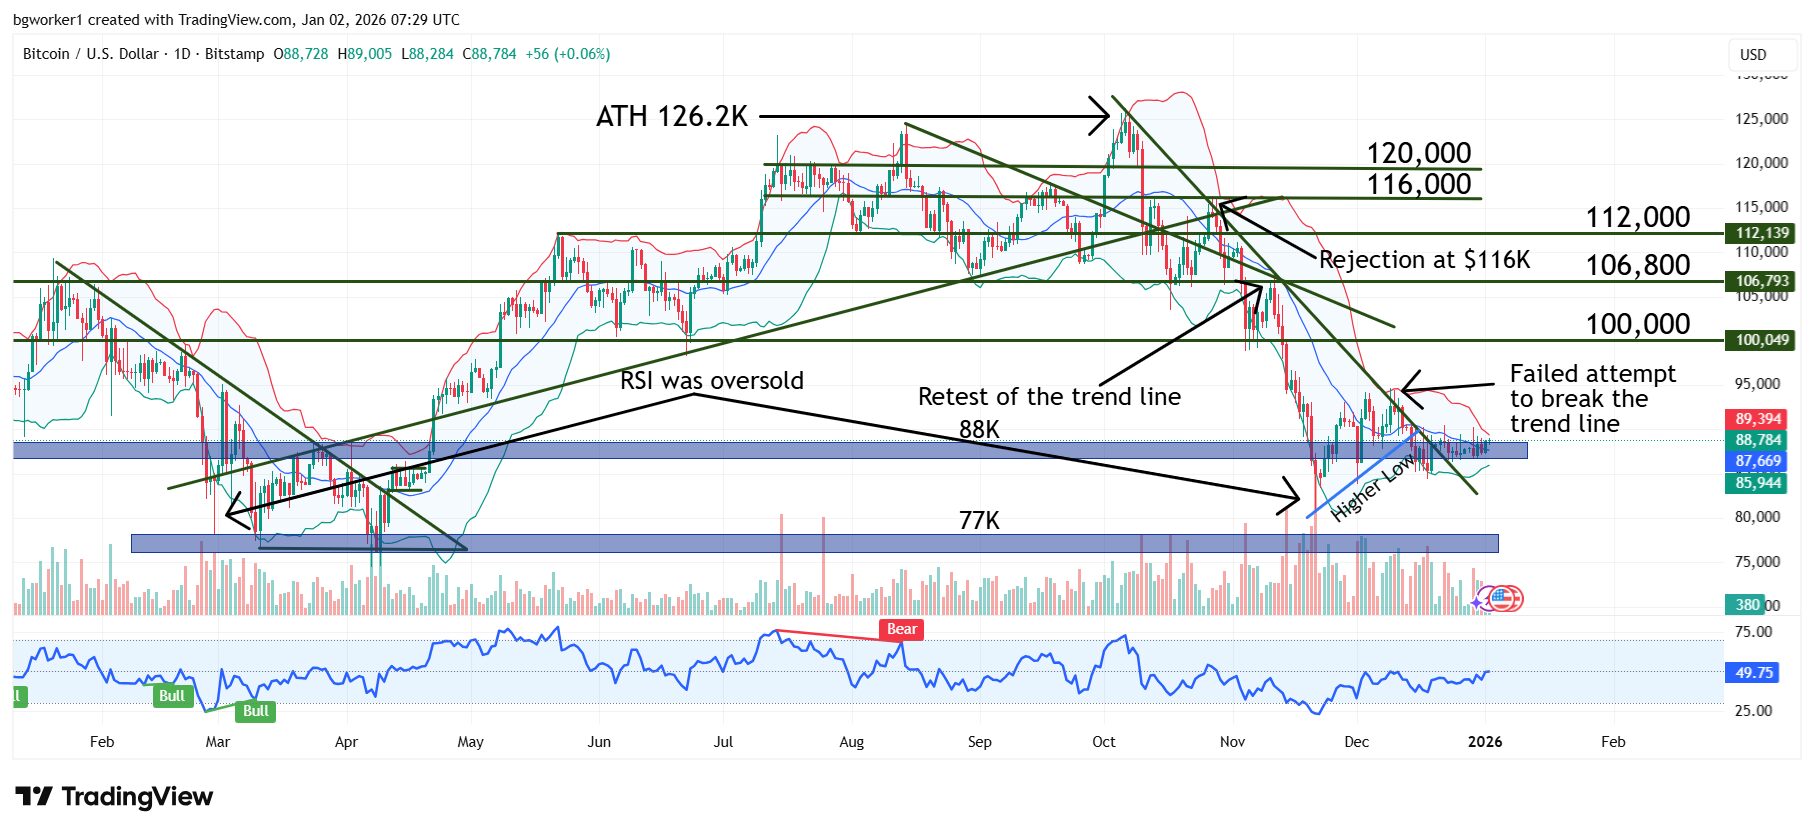
Chart Analysis – BTC/USD
The price is currently stuck in a very tight range, mostly due to the New Year and the lack of involvement from major players and retail traders alike. The Relative Strength Index (RSI) is moving in the middle of its range and is mostly flat, without giving any particular signal.
This compression will most likely end with a strong breakout, but the direction is difficult to anticipate given the flat movement. For the time being, the limits of the range are $86,600 and $90,000. A break of either one of these barriers would mean that volatility is back and that we will likely see price action that’s more dynamic.