Bitcoin: Market-Wide Selloff or Normal Pullback?
Is Bitcoin Gearing Up For A Move Up?
Over the last couple of days, Bitcoin dropped dramatically from $19,500 highs to as low as $16,200 and it is currently trading at $16,800. This behavior has been dubbed a “market crash” by some, while others simply consider it a normal pullback in a healthy trend.
I happen to fall into the latter category and actually, this pullback is something I’ve warned about in previous articles. Let’s dig deeper and see if we can find the reason behind the drop.
The elephant in the room is obviously the $20K price tag, with which Bitcoin flirted back in December 2017. To be more precise, on December 17, 2017, Bitcoin reached a high of $19,994 according to CoinMarketCap data, thus it never made it past $20,000, except maybe on some lesser-known exchanges.
The $20K level was recently tested again but Bitcoin experienced a massive wave of sellers in its close vicinity. Of course, this is a major technical resistance level but also a psychological level, mainly because once the asset goes above it, it will enter price discovery mode, meaning that there’s no historical data (and no other upper levels) to hint about Bitcoin’s movement. Also, it’s the point where the Crypto Winter or The Big Drop, or whatever you want to call it, started. In other words, investors and traders “fear” $20K, thus a large portion of market participants decided to take some of their profits off the table by selling, which in turn brought price down and created a snowball effect which determined others to sell as well.
BTC/USD – What Could Be Next?
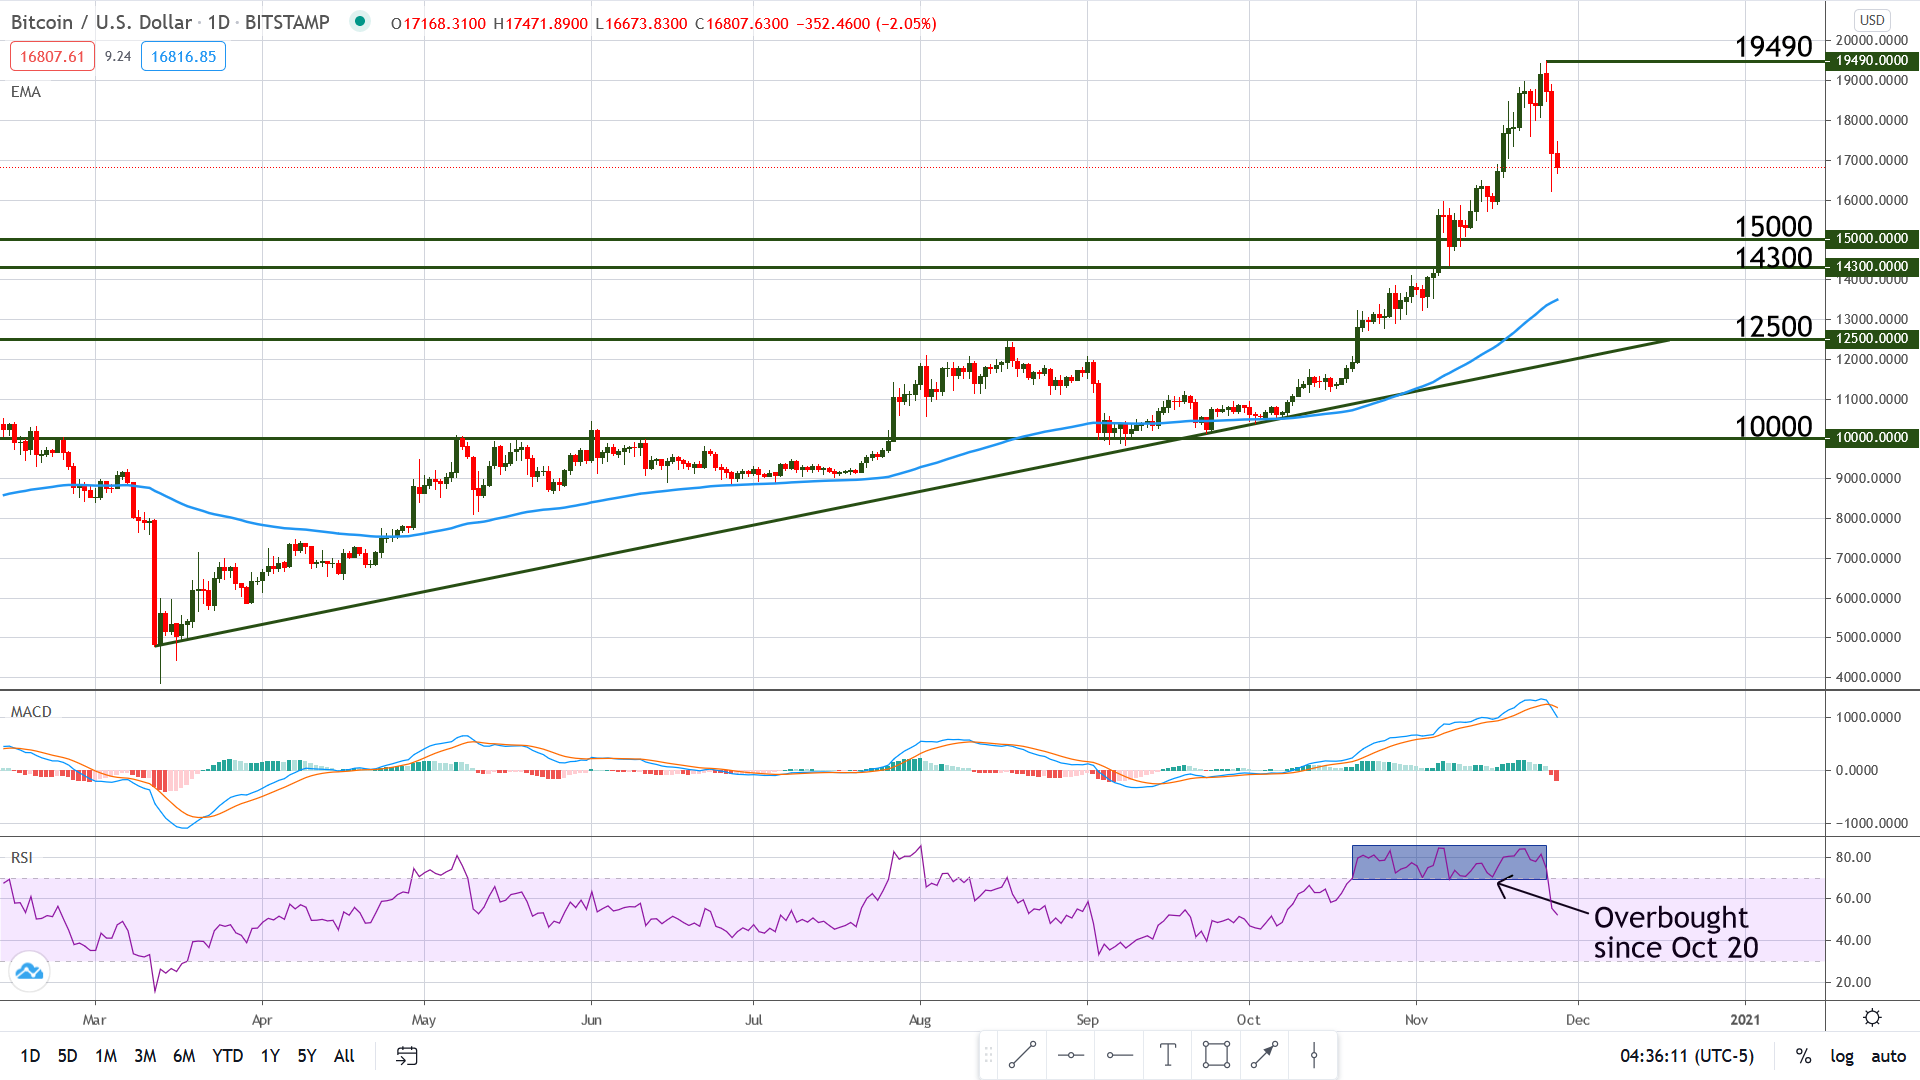
Bitcoin is trading at $16,812 having bounced off lows at $16,218. It’s a drop of more than $3,000 from the recent highs, which has startled many investors, but is it a market reversal or a simple pullback? The answer is: at this time, we are dealing with a move that can be categorized as a pullback, a normal price pattern that formed due to price overextension (the RSI was trading in overbought for over a month and price moved straight up for a long period).
Although at this time we should treat the drop as a healthy retracement in an uptrend, it doesn’t mean that it cannot turn into a full-scale reversal. The levels to watch are $16,200 (the recent low) and $19,500 (the recent high) and as long as price remains between these levels, the next move is uncertain.
A break of $16,200 would create a lower low and would indicate that the bearish move may be more than a simple retracement. If that happens, price is prone to a drop into the $15,000 area. On the other hand, if price stabilizes above $16,200 – $16,000, we may see another assault on $20K, or at least a period of ranging movement between support and resistance.