Bitcoin ETFs: Shaping the Future of Crypto
Bitcoin’s Chart Analysis: Beyond the ETF Hype
The debut of spot Bitcoin ETFs has caused excitement in the crypto market, attracting both new and experienced investors. These ETFs simplify Bitcoin investment, making it easier for those hesitant about digital wallets and exchanges. However, the impact on Bitcoin’s core principles and long-term stability is a subject of discussion.
After the SEC approved 11 Bitcoin ETFs, there was a rise in active Bitcoin wallets, showing increased interest. Initially, the number of wallets holding any amount of BTC above zero surged by 53 million. Yet, later data indicated a decrease in Bitcoin holders, suggesting a preference for ETFs over direct ownership.
As per Santiment data, there are 729.4K fewer Bitcoin wallets with more than 0 BTC than a month ago. This shift could affect Bitcoin’s decentralized nature and reduce on-chain activity.
The popularity of ETFs hasn’t changed Bitcoin’s supply-demand dynamics as these funds can hold actual Bitcoin and futures contracts. This raises questions about whether ETFs are promoting adoption or creating a risky derivative market.
There has been a rise in speculative trading, especially in derivatives, which could lead to market volatility. The buzz around Bitcoin ETFs and the promise of quick profits echo past speculative bubbles, indicating a need for caution.
In conclusion, while Bitcoin ETFs have made the cryptocurrency more accessible, they present challenges such as a potential shift from direct ownership and increased speculation. The future impact of these ETFs on the crypto market is uncertain, underscoring the importance of continued observation and regulation.
Chart Analysis – BTC/USD
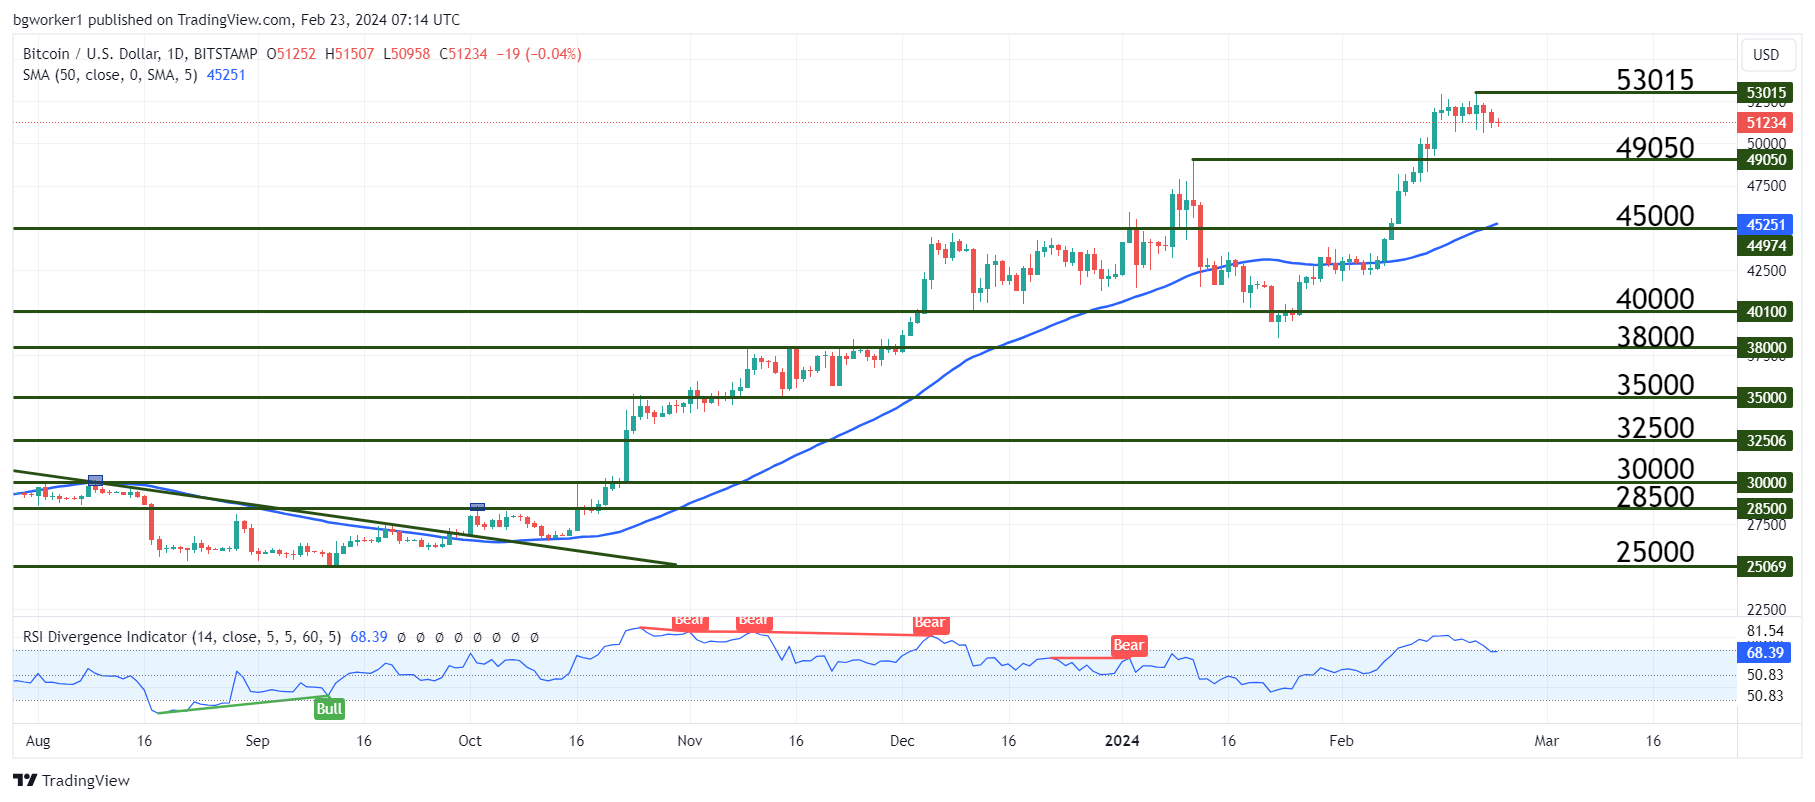
It looks like the massive rally that started just below $40,000 has found a temporary top at $53,000, more precisely at $53,015, according to TradingView charts.
For several days, Bitcoin has moved almost completely sideways, in a straight line, with the open and close prices matching the previous candle. At the moment, the bears are trying to break the lower barrier of this tight range but the overall bias remains heavily bullish. Despite the uptrend, it’s very possible to see a deeper pullback than the current one.
The Relative Strength Index (RSI) indicated a very strong overbought condition just a few days ago and at the moment, it is re-entering its normal range (breaking back below the 70 level). As long as the previous high ($49,050) remains intact, the trend is still bullish. A break below that level could incentivize more sellers to come in.