Crypto Summer Already? Bitcoin at Multi-Year Highs
Bull Run in Full Swing. RSI Shouts “Pull Back”!
The leading cryptocurrency is experiencing a post-ETF launch resurgence and is trading at multi-year highs after a brief dip that followed the spot Bitcoin ETF approval by the SEC.
With Bitcoin trading just above $52,000, there’s already talk about the All-Time High (ATH) at $69,000 which was reached in early November 2021. The yearly high at $49,000 was already broken and a retracement was just finished, so it looks like the ball is in the bulls’ court. It’s their move!
We talked about the accumulation that took place during the dip, immediately after the ETF approval. Seeing the surge that Bitcoin is currently on, it is clear that there was an accumulation by the big boys, aka whales. The question now is: how greedy are they? If whales bought around $40K, a few weeks back, they are clearly in profit right now. The longer they hold, the more profit they make but as soon as some of them start taking profits, the others will soon follow because the price will start to slow down.
And let’s not forget that The Halving is approaching fast and historically, such an event is preceded by a retracement. According to crypto analyst Rekt Capital, pre-halving pullbacks stood at -38% back in 2016 and -20% in 2020. After each of these dips, Bitcoin recovered and posted significant gains but it is important to know that a retracement may come first, and prepare for it accordingly.
Chart Analysis – BTC/USD
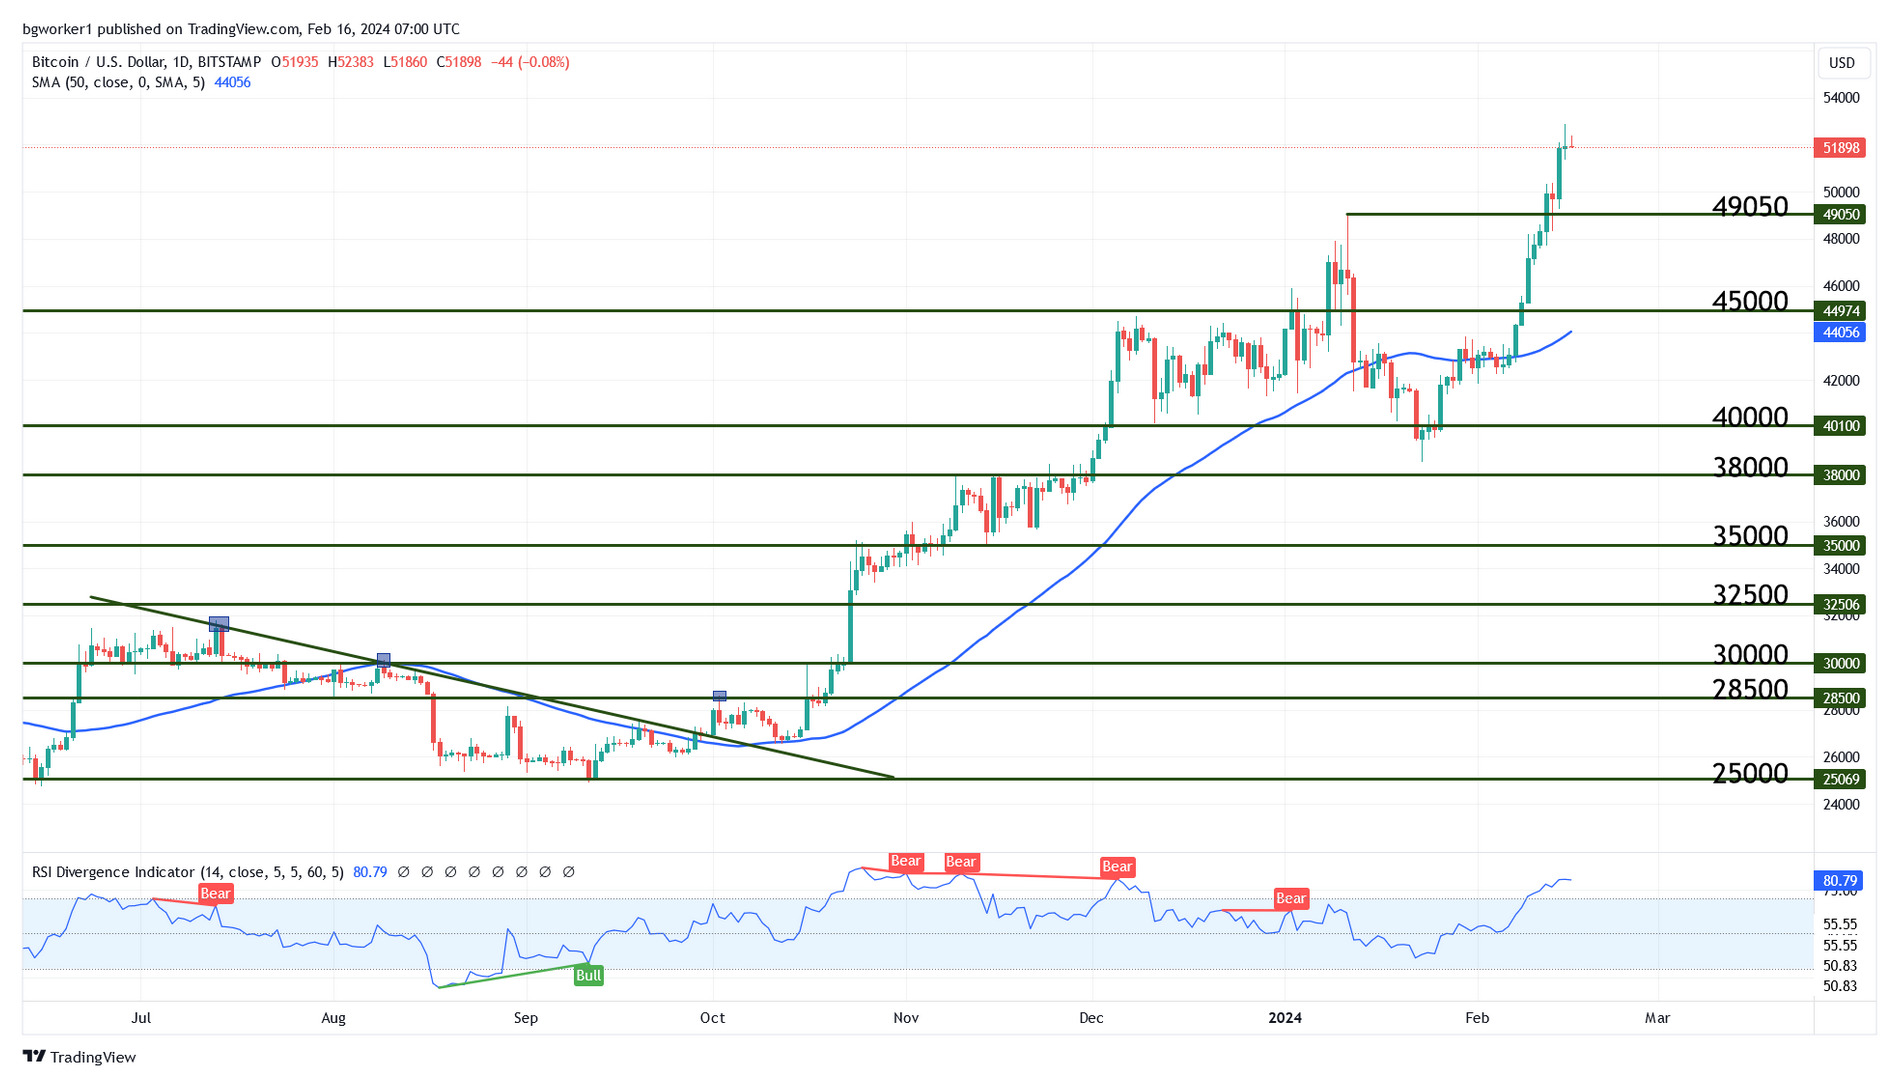
The most recent rally took Bitcoin above the previous high located at $49,050. The crypto King is now changing hands at $51,820 after reaching a multi-year high at $52,884.
The move that started just below $40,000 has taken the RSI deep into overbought territory not only on the Daily chart but also on a Weekly one. Moreover, on the Weekly chart, the RSI is showing bearish divergence: the price has made a higher high but the RSI is only showing a lower high. Adding to that is the fact that in early September 2021, Bitcoin bounced lower from $52,000, which is the current price.
To sum it up: we have a very strong bullish impulse but the RSI is overbought on the Daily and Weekly charts, bearish divergence is present, and there’s an important resistance level. It’s true that “the trend is your friend” but sometimes even friends cannot be trusted 100%.