Bitcoin ETF Inflows Swell. “Buy the Dip” Mode Activated?
Bitcoin Treads Water Ahead of Crucial NFP Release
Bitcoin is starting to attract some love from investors, signaling that sentiment is turning positive after a series of outflows from spot Bitcoin ETFs. In last week’s post, we talked about a shift from BTC Exchange Traded Funds (ETFs) to Ethereum ETFs and how the latter brought in $307 million, while Bitcoin ETFs only saw around $81 million in inflows. Now the scene has changed again, and Bitcoin ETFs are back on top.
On Tuesday alone, BTC ETFs reported inflows of roughly $333 million, and on Wednesday, the inflows amounted to $300 million. On Tuesday, Ethereum ETFs saw more than $135 million in outflows, but on Wednesday, the number was much lower, at only $38.2 million in withdrawals.
This should be viewed as a profit-taking situation more than an alarming investor behavior. Ethereum recently posted an All-Time High at $4,958 (Bitfinex data, via TradingView) on August 24. After such a historic event, it’s somewhat normal that people who bought lower start thinking about closing their longs and pocketing a nice profit. ETH’s chart also showed clear bearish divergence on a Daily timeframe, so the ETF outflows are justifiable.
Now the outflows from ETH ETFs are much lower, and Bitcoin ETFs are already experiencing inflows. This behavior points towards a “buy the dip” scenario.
U.S. Jobs in Focus. More Than One Cut in 2025?
The focus is now on U.S. data, which will likely shape the Fed’s monetary policy going forward. According to the CME FedWatch tool, currently there is a 98% chance the Fed will cut the interest rate by a quarter point at the September meeting. The question now remains how many times the Fed will cut in 2025.
Thursday’s ADP Non-Farm Employment Change report came out softer than anticipated. Since this report tries to mimic the NFP that will be released later today, we could see that fewer non-farm jobs were created, making the case for multiple rate cuts this year. Lower rates usually favor risky assets such as cryptocurrencies.
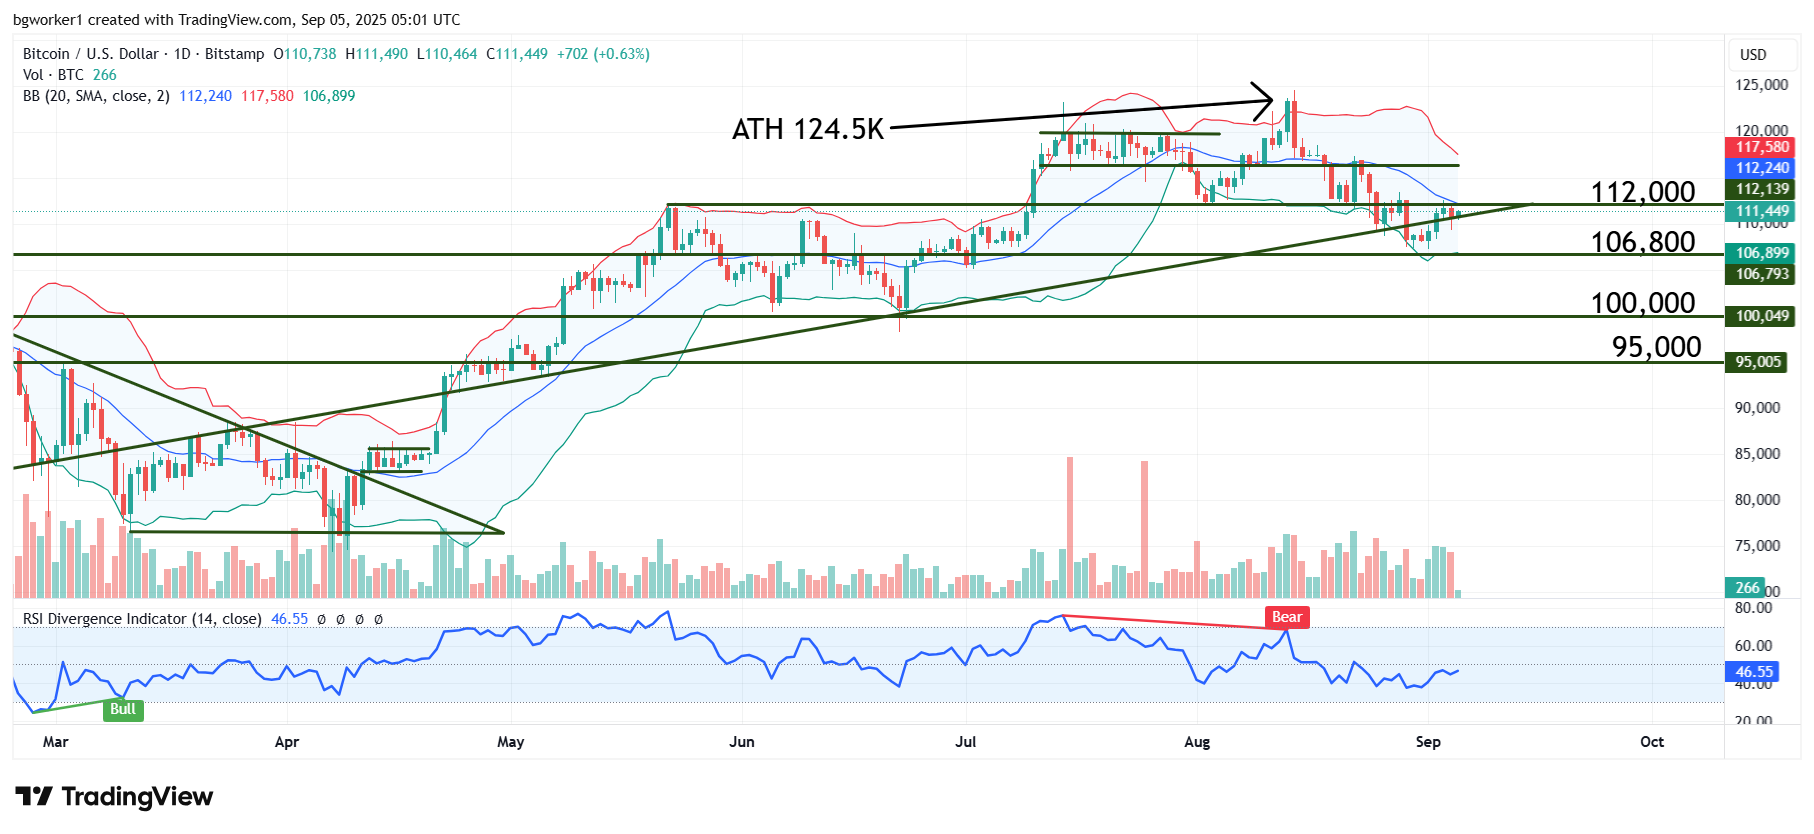
Chart Analysis – BTC/USD
On Wednesday, Bitcoin reacted once again to the level at $112,000, this time hitting it from below and bouncing lower. If the pair returns above the long-term bullish trend line seen on the chart below, then the bulls will be on route to regain $112K and to possibly head higher. However, if BTC fails to close above the trend line soon, we will likely see an encounter with $106,800 support.
The RSI is moving in the middle of its range and does not show any clear signal. There is no clear bias at this time, but ETF inflows paint an optimistic picture. If the U.S. jobs data favors a rate cut (or multiple cuts this year), we will most likely see bullish action.