Bitcoin Bulls Struggle After Barely Hitting New ATH
RSI Signals Correction Incoming. $120K Next?
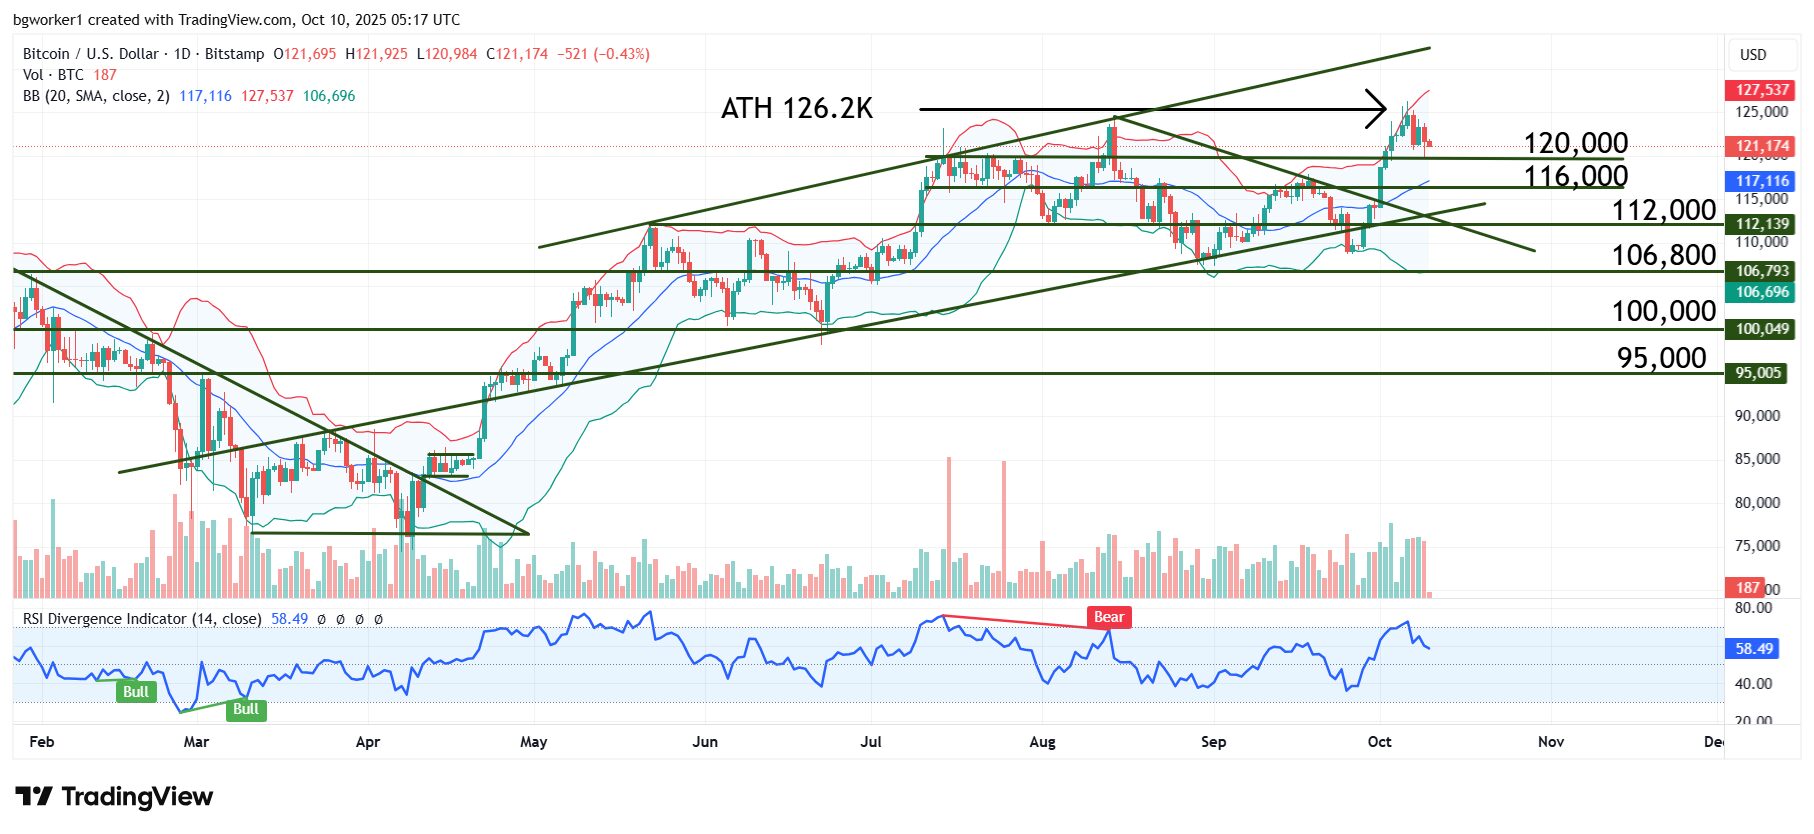
Bitcoin was pushing into uncharted territory, having traded as high as $126,270 on Monday, October 6; with this new ATH in place, many pundits see $130K as the possible target. However, downside risks are starting to emerge.
The main catalyst behind this rally is institutional buying, mainly ETH activity, but also the Fed’s dovish stance, with two more rate cuts expected by year’s end, as well as the U.S. government shutdown.
Bitcoin Exchange Traded Funds (ETFs) have seen massive inflows, totaling $1.19 billion on the day of the All-Time High (ATH), October 6. The vast majority of volume came from BlackRock’s IBIT fund, which registered $970 million in inflows.
But while ETF inflows add to the optimistic sentiment and act as a tailwind, liquidations are a cautionary tale. At the time of writing, more than $538 million worth of leveraged positions across the market were liquidated in the last 24 hours. After the latest ATH, the price retreated and wiped out longs, with Bitcoin traders bleeding more than $167 million, followed by ETH traders with $128 million. Solana, Doge, and XRP were among the biggest losers as well.
Chart Analysis – BTC/USD
Before the ATH was reached, we could already see a few candles with long wicks in their upper part. This is also true for the ATH candle itself. Long wicks are a sign of rejection (in most cases), and this, combined with decreasing volume, generated a big red candle on the next day. Profit taking played a factor as well.
It must also be noted that the new peak is not significantly higher than the previous ATH, which is a sign of weakness, especially if a correction begins. On the other hand, if we see a sudden inflow of longs, BTC is likely to end up much higher, possibly in the $130K area.
Since the price is in uncharted territory, we do not have any technical resistance, except the psychological levels at big, round numbers ($130K, $135K, etc.). The first technical resistance may be located at the upper barrier of the parallel channel, which is roughly in the $133 area, depending on how fast the price moves towards that area.
The Relative Strength Index (RSI) was overbought earlier in the week, which indicates exhaustion and a possible correction into the $120K area. If this barrier is breached, we may see a deeper pullback, possibly towards the support at $116K.