Bitcoin Breaks Out in Time for Christmas
$50k Barrier Reclaimed.
by Bogdan Giulvezan
With a few minor exceptions, all Top 100 coins are in the green this week, with some of them posting double-digit gains. The biggest gainers in the Top 10 are TERRA (LUNA) with more than 54% in the last 7 days and Ripple (XRP) with almost 21% over the same period.
At the time of writing, Bitcoin is up 6.0% for the last 24 hours and 8.50% for the last 7 days, trading at $51,200. This is its highest level since December 7 and it’s a 22% recovery since its most recent low at approximately $42,000.
What fuelled this climb and where will it stop are definitely legit questions but the answer may not be very straightforward. On one hand, we have Holiday-specific bursts of volatility, which can take price either way, disregarding fundamental factors, and on the other hand, we have the gruesome situation of the Turkish Lira, which has lost more than 50% of its value against the US Dollar.
Since the pandemic hit, the inflation situation has been a constant topic and a pressing matter for governments across the globe. Turkey is “leading” the pack of countries with inflationary issues, as shocking figures show that Turkish inflation stands at 21.7% in November.
As a result, Turks have turned to Bitcoin (BTC) and USD Tether (USDT) to counter the devastating effects of this massive inflation. This is probably happening in other countries as well, thus the increased demand for Bitcoin and the consequent rise in its price.
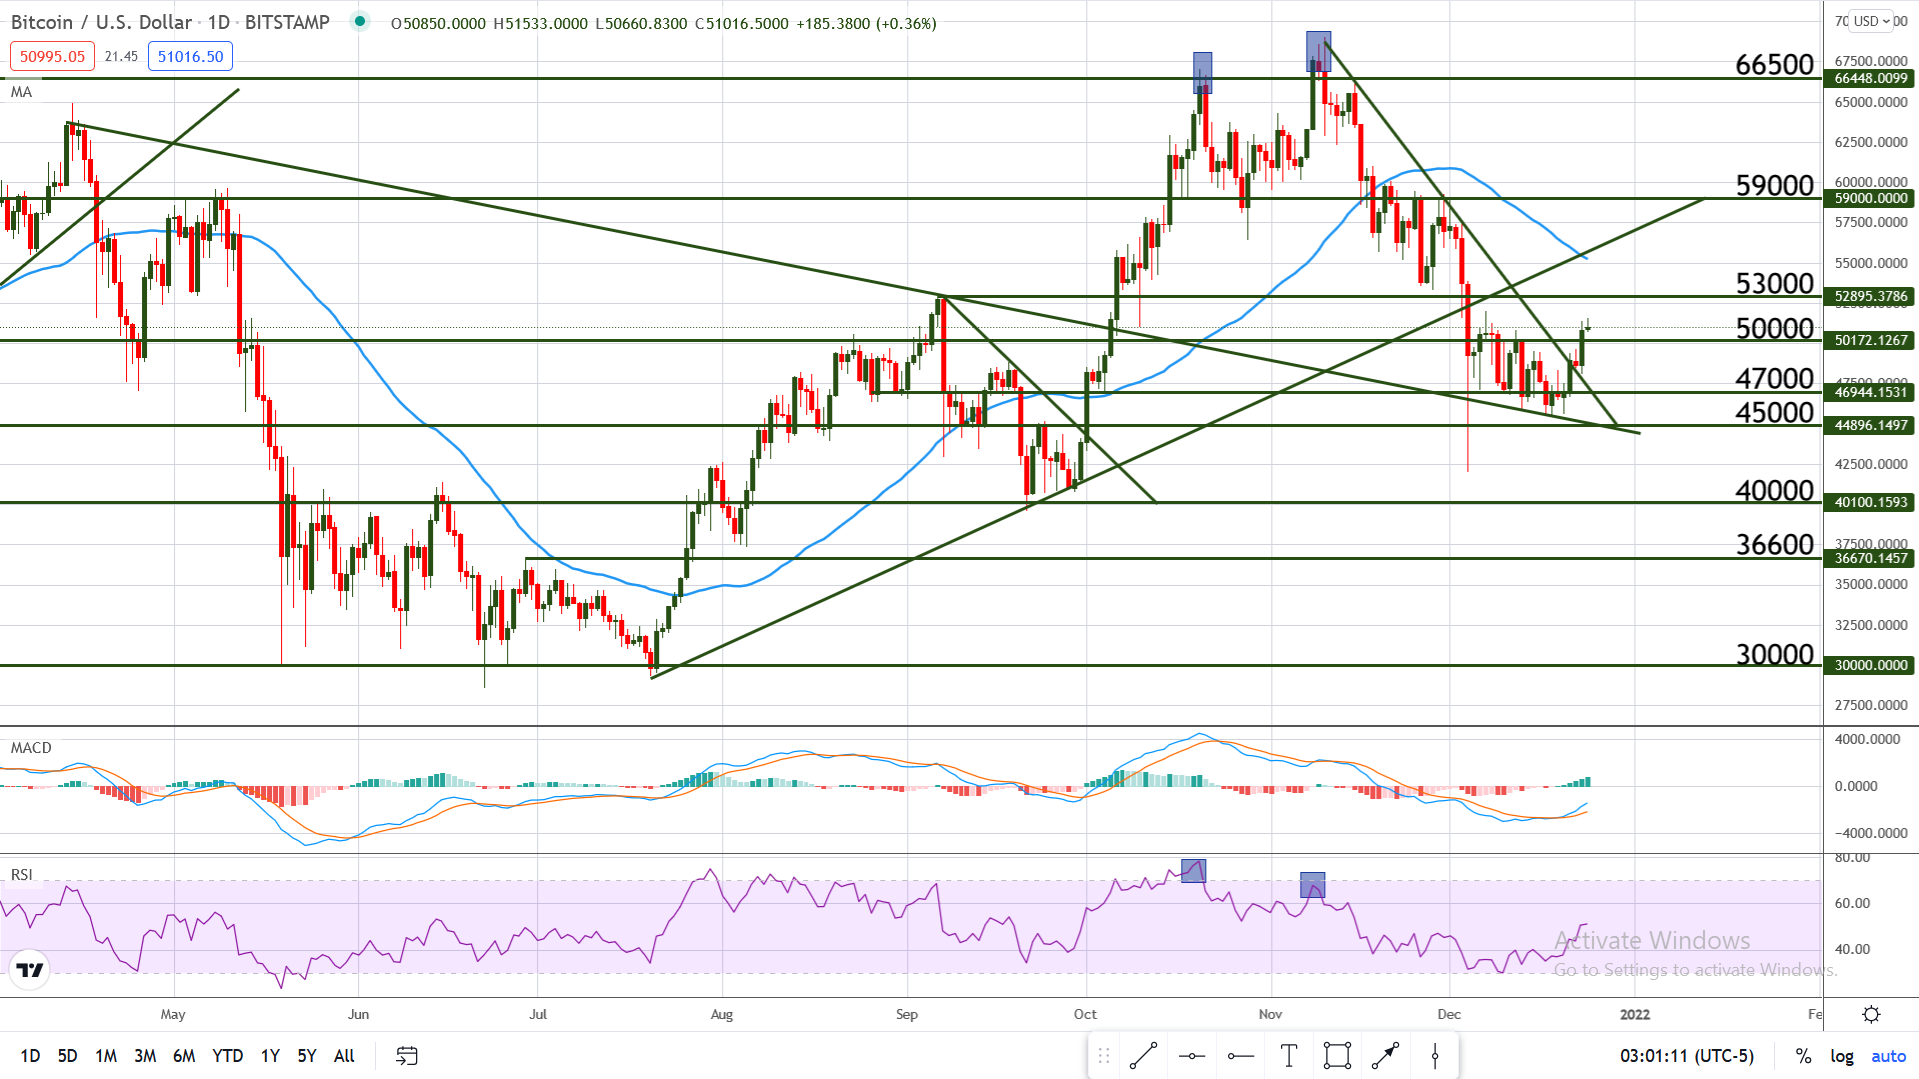
Chart Analysis – BTC/USD
The pair seems to have formed a bottom at roughly $45,500 and is currently trading above the key psychological and technical level at $50,000. The price bounced higher and broke resistance after touching several times the long-term bearish trend line seen on the Daily chart below, which combined with $45K created a confluence zone.
The MACD is showing a bullish cross, which indicates that momentum is picking up, and the Relative Strength Index is just crossing its 50 level. It is often considered that an RSI value below 50 indicates a bearish market and on the other hand, when the indicator crosses above 50, the market turns bullish. Taking a look at the chart and the RSI position, we can see that most of the drop that started at the recent All-Time High happened with the RSI below 50.
Following this train of thought, we may witness the start of a bull run if the RSI can cross and remain above 50. However, there are no absolutes in trading, and a sudden drop below $50K would invalidate a bullish scenario at least for the time being.