Bitcoin Breaks Above $55K, Here’s What’s Next
Breakout!
Bitcoin has finally managed to break key resistance and to print a new significant high above $55,500, successfully surpassing the early-September peak at 53,000. At the time of writing, the flagship cryptocurrency is up 23.55% for the last 7 days and continues to move north, which could mean that $59,000 resistance is the next destination.
Since the early days, Bitcoin has been a polarizing subject, with advocates on both sides and with counter-arguments thrown in the mix every day. Of course, we can’t expect things to change now, and it seems that Bitcoin’s recent surge has triggered yet another debate. On one hand, we have the bull Mike Novogratz, while the bears are represented by Steve Hanke, an economist, and professor of applied economics at John Hopkins University.
Mike Novogratz, who is a renowned crypto investor and CEO of multi-billion dollar blockchain investment firm Galaxy Digital, recently said in a CNBC interview that he sees Bitcoin surpassing the highs and that the entire crypto market is set for “parabolic moves”. In his words: “I literally see a scenario where we take out the highs in Bitcoin, and we have one of these parabolic moves in all of crypto going into the fourth quarter.” He also added that digital assets that are bullish going into Q4, usually continue to go up because investors tend to pile in.
On the other hand, Professor Steve Hanke predicts a market crash based on the fundamental principle that “what goes up must come down”, adding that “Bitcoin certainly isn’t exempt from this law. BTC’s extreme volatility & speculative nature serve as reminders of the up and down law”. His somber scenario sees Bitcoin as low as $10,000.
What goes up must come down and that’s a fact, but the opposite is true as well in the markets: what goes down must come up and we could argue that Bitcoin is in the “going up” phase because it is recovering from $30,000 lows and it has not yet surpassed the All-Time High.
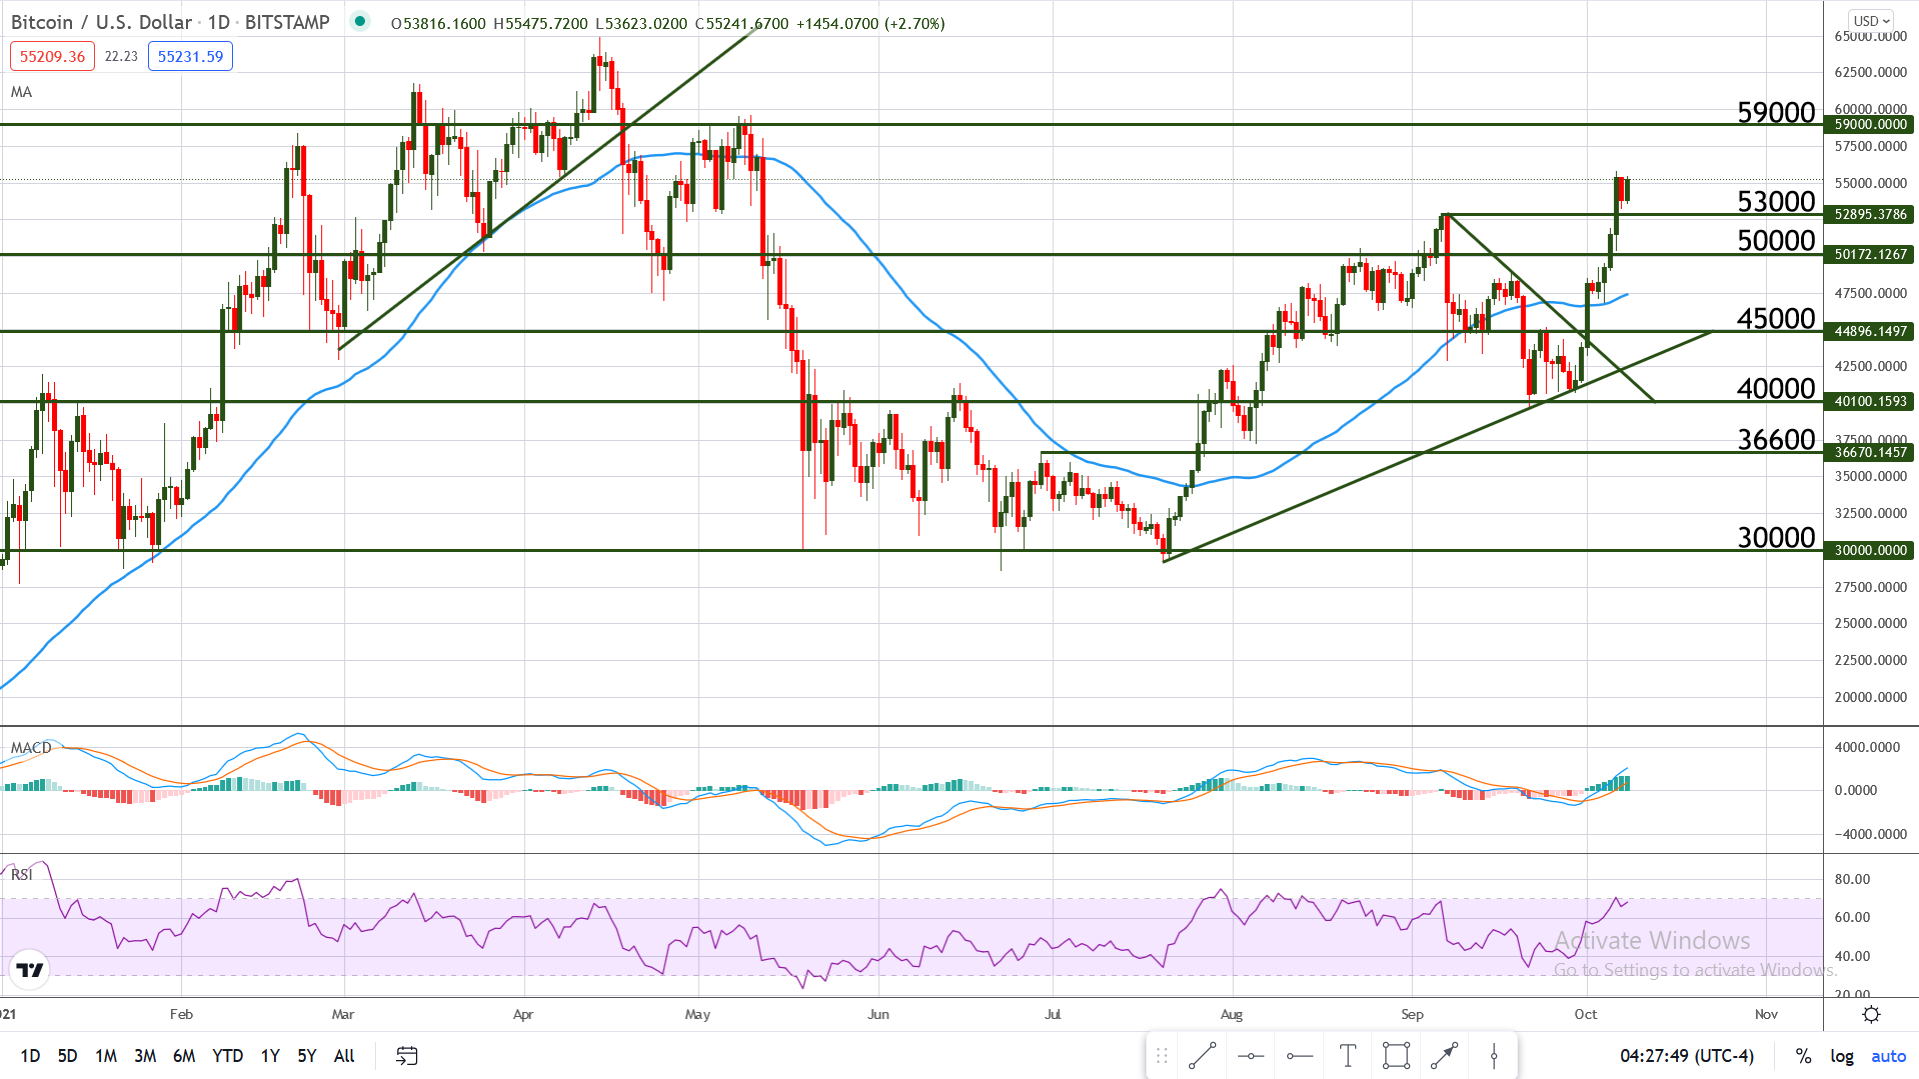
Chart Analysis – BTC/USD
Since the bounce on the bullish trend line seen on the Daily chart below, BTC has been climbing aggressively and managed to surpass key levels, including the psychological resistance at $50,000 and the previous peak at $53,000.
The green candles are long and full, the MACD lines are spread apart, and price is trading above the 50 days Moving Average, which are all bullish signs that indicate that we may see a touch of $59,000 in the near future. However, the RSI is approaching the overbought level, which may trigger a pause in the climb or a bounce lower. If that is the case, $53,000 may act as support.