Bitcoin Rallies as Institutional Demand Offsets War Risk
ETF inflows surge as BTC breaks above $77K resistance
Bitcoin reached an 11-week high on Wednesday but pared some of the gains on Thursday as tensions in the Middle East escalated. The US and Iran are playing a game of who lifts their respective blockade first, which is weighing on the cryptocurrency market and is deepening the energy crisis.
According to President Trump, the current truce has no deadline and will stay in place until Iran submits a peace offer. On the other hand, Tehran doesn’t want to sit at the negotiating table until the US lifts its blockade. The main demands of the US are still related to the opening of the Strait of Hormuz and Iran’s nuclear program.
Despite the uncertainty generated by the war, Bitcoin is resilient and seems to have shifted into strength mode. It now shrugs off negative headlines and climbs on positive ones, unlike before, when even minor concerns would send it lower.
This shift in sentiment is also shown by the activity of spot Bitcoin ETFs. Just a while back, a day with positive inflows was a rare thing, and generally, outflows outpaced inflows. According to Coinglass data, the last 7 days have been positive, with inflows totalling over $1.8 billion. Out of the last 12 days, only 1 day has been negative, which clearly shows renewed interest.
Chart Analysis – BTC/USD
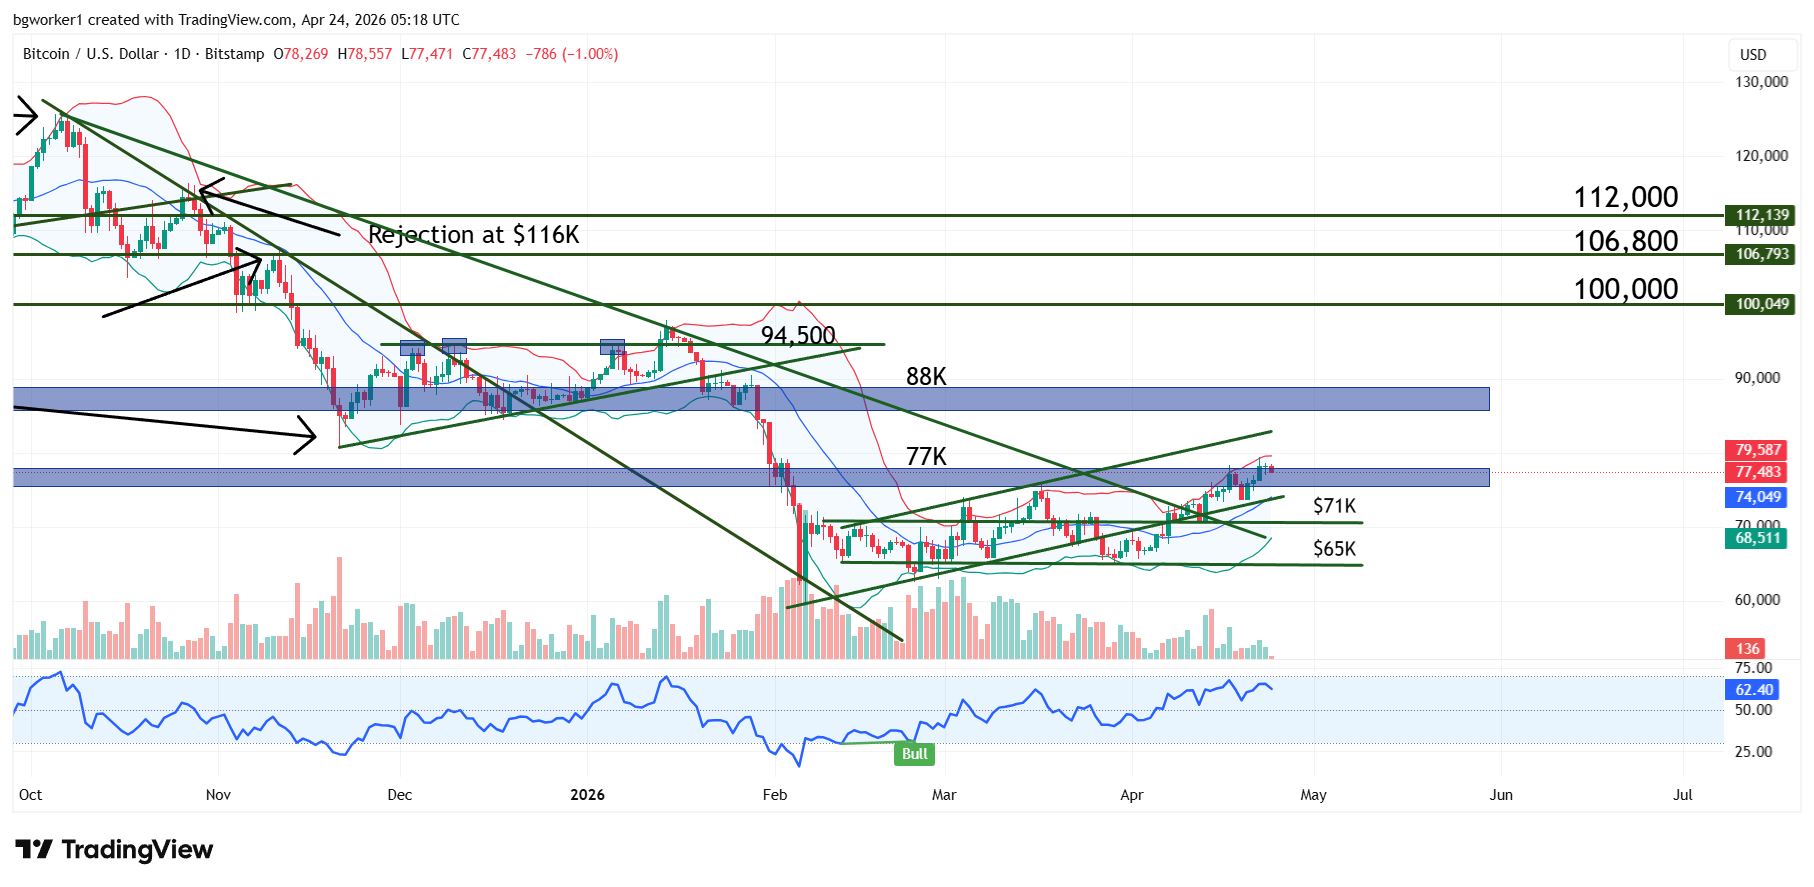
On Wednesday, Bitcoin reached a high at $79,460, breaking above the previous high and exiting the $75K – $77K resistance zone. This is an important development for future price action because it’s the first break of a major hurdle and shows buying pressure.
The next move could very well be a bearish one, but this should not be considered a sign of weakness, but normal market behavior. Many sell orders accumulated during the downtrend, and these orders sit in close vicinity, above the current price. Once these are triggered, we will see a move down. But how the bulls respond will be the more interesting part. If these sell orders are absorbed, the price will start moving up, potentially triggering their liquidation. And because a sell order is always closed with a buy order, we will see increased buying activity.
The first bullish target is the upper part of the horizontal channel, located around $83K, followed by the resistance zone between $86K and $88K. We can expect to see pullbacks before those targets are reached, especially when the RSI enters overbought territory.