The Fed Interest Rate Is Down. But So Is Bitcoin.
The Battle for Trend Lines: Winner Takes Control of Medium-Term Price Action.
On Wednesday, the Federal Reserve’s FOMC decided to cut the interest rate by 25 bps, taking it from 4.0% to 3.75%, as it was largely anticipated by the markets. The decision was not without controversy, as 3 members disagreed with the majority, according to the FOMC Statement issued on December 10.
FOMC member Stephen I. Miran voted for a 50 bps reduction, while Austan D. Goolsbee and Jeffrey R. Schmid preferred to hold the rate steady. This is the first time since 2019 when three FOMC members voted against a policy action.
The FOMC statement also acknowledged that labor-market risks rose, while inflation remains somewhat elevated. Fed Chair Jerome Powell called this a challenging situation during his press conference. Regarding the timing of the next rate cut, the FOMC statement informed that “the Committee will carefully assess incoming data, the evolving outlook, and the balance of risks”.
This ‘wait and see’ rhetoric disappointed Bitcoin bulls, which was immediately seen on the charts. Bitcoin tumbled below $90K soon after traders digested the FOMC statement and Powell’s presser. The initial reaction was a push that reached as high as $94,500, but it was very short-lived lived and now we have a double top at $95K on the hourly chart.
Despite Bitcoin’s weakness, ETF inflows have started to come in this week, at a larger pace than last week. On Tuesday, spot Bitcoin ETFs added $151.90 million, and on Wednesday, they added more than $223 million, according to Coinglass data.
Is this a sign that Bitcoin is starting to feel appealing again? Well, its smaller peer, XRP, saw consecutive inflows each day since its inception, but the price has been sliding lower and lower. So maybe at this time, just ETF inflows are not enough to spark a rally.
Chart Analysis – BTC/USD
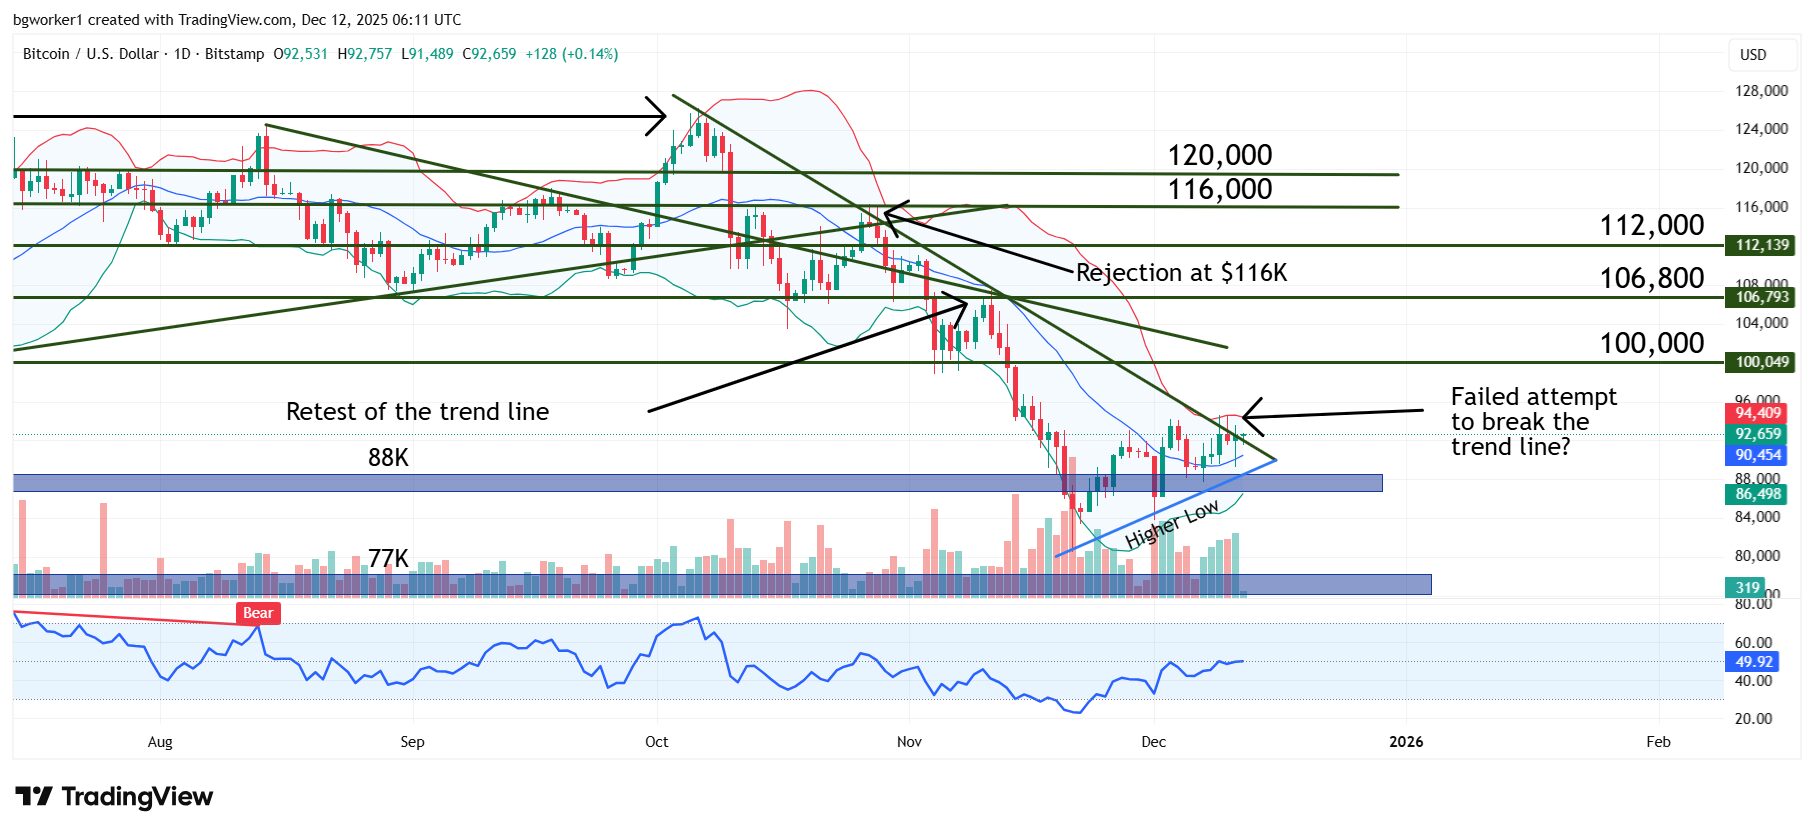
The bears scored a major victory, or the bulls took a big loss, depending on how you want to look at it. I am talking about the rejection at the long-term trend line drawn from the All-Time High (ATH). On Tuesday, the bulls breached the line, and it looked like a clean breakout, with enough volume. However, by the end of the day, the sellers managed to take Bitcoin back below the trend line.
The following days, the sellers kept control and took the price even lower but Thursday’s candle was green and with a long lower wick, so at least there are some bullish clues scattered along the charts.
This is now the battle of two trend lines: the major bearish line drawn from the ATH and the smaller one drawn from the November 25 low. If the bears manage to break the bullish trend line (blue on the chart), we can expect to see a move into the $80K territory unless some fundamentals change. A break of the bearish trend line will open the door for a move into $100K but the current sentiment does not support a fast move to that destination.