Strategy’s Saylor Remains Bullish as Bitcoin Dips Below $100K
xsdCrucial Battle at $100K as RSI Approaches Oversold and ‘Buy-The-Dip’ Opportunities Arise
Bitcoin fell below the historic $100K threshold for the first time since June, but ‘smart money’ saw this as a great opportunity to buy the dip. The price recovered from a low of $98,900 to $104,500, and the main driver seems to be the U.S. jobs data that came out better than anticipated on Wednesday.
The Non-Farm Payrolls report has been missing in action lately, due to the government shutdown, which means the privately-issued ADP Non-Farm Employment Change report has gained higher importance. Wednesday’s release showed that 42K new jobs were created in the private sector, which was 10K above the forecast. This data, combined with a better-than-expected ISM Services PMI and hopes that the U.S. government shutdown may end soon, improved investor confidence and tilted the balance in favor of riskier assets.
But despite the recent slump in the crypto market, Bitcoin proponent and Strategy CEO Michael Saylor believes that the coin is simply “on sale”. Strategy, Inc. (formerly MicroStrategy) is currently the biggest holder of Bitcoin, with a stash of 641,205 coins.
Earlier in the year, Saylor predicted a whopping $150K price tag for Bitcoin by the end of the year. Right now, with Bitcoin hovering around $100K, it’s pretty wild to think it will gain almost 50% in just under 2 months. But wilder things have happened, so it’s not impossible, just improbable. According to Polymarket bettors, the chance of Bitcoin hitting the $150K mark is just 9%. To put things into perspective, the Polymarket chances for the same target were 51% in June, so it’s safe to say that sentiment has turned bearish.
Chart Analysis – BTC/USD
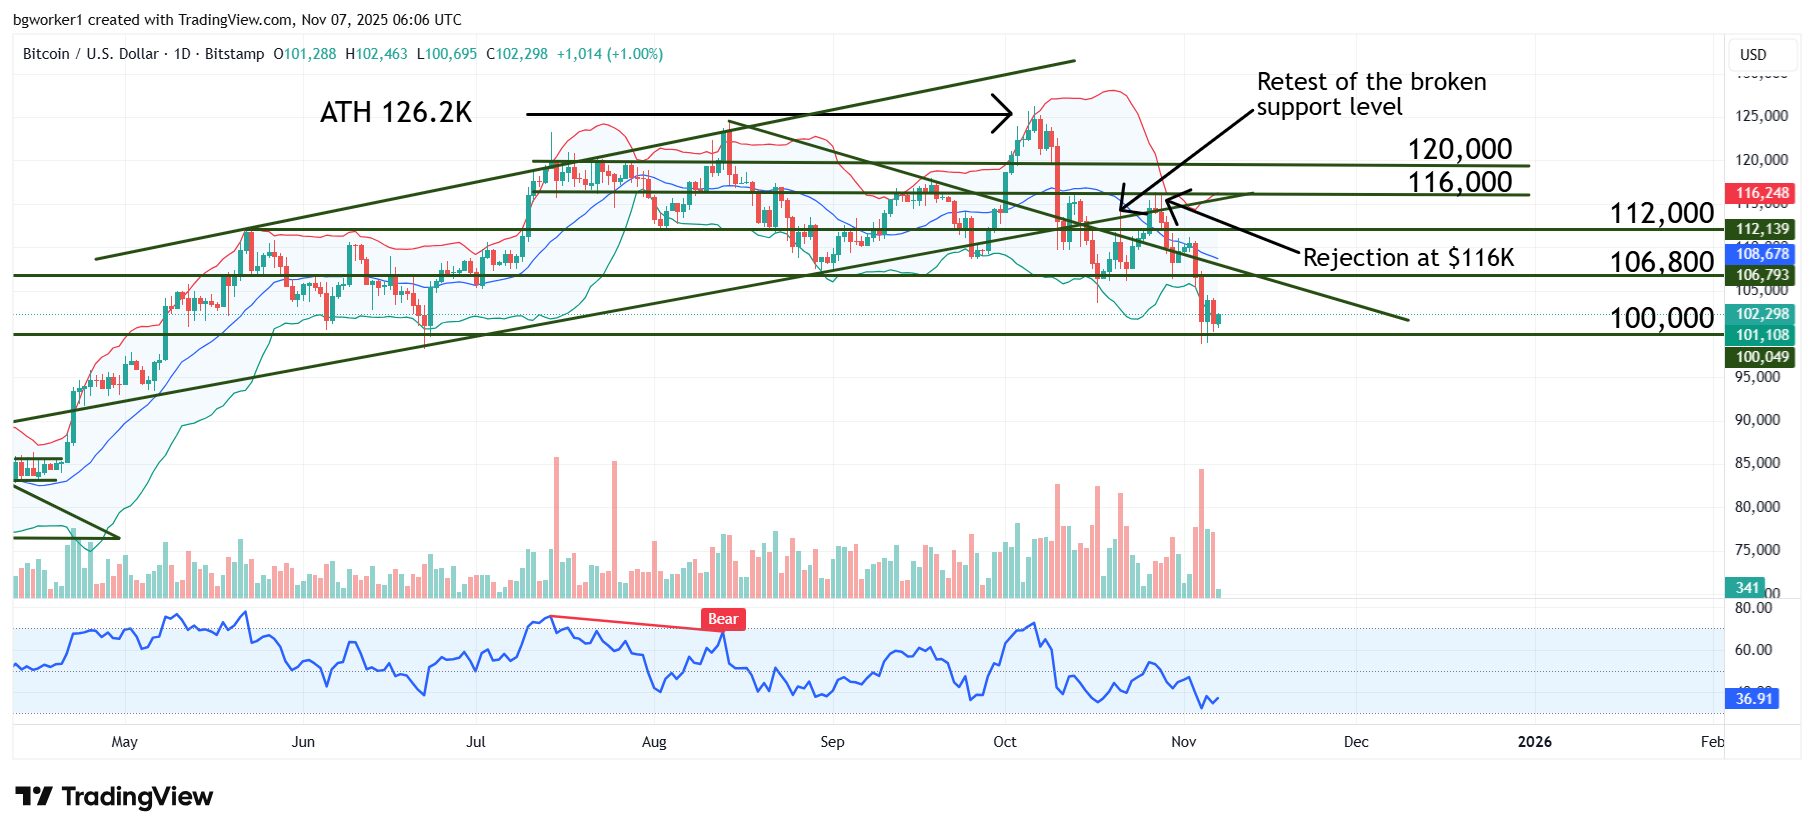
Bitcoin last touched the $100K level in June of 2025, and right after that, it skyrocketed to $123K, which was the All-Time High (ATH) at that time. However, there are a few differences between the June bounce and the current test of $100K.
In June, the red candles were small, volume was low, and Bitcoin had already bounced near $100K. This time, the red candles are long, showing momentum, and volume is high. On the other hand, the Relative Strength Index (RSI) is much closer to oversold, and it is already oversold on the 4H chart. Also, the pair is testing the lower Bollinger Band, which is a place where a reversal may take place.
But for any long-lasting change of direction, Bitcoin bulls have to close a daily candle above the bearish trend line seen on the chart and above the previous support located at $106,800.