Gold Comes Off Highs. “Smart Money” Is Into Bitcoin Again?
Bitcoin Exits the Parallel Channel. Uptrend Prone to Short-Term Risks.
On Tuesday, October 21, Gold recorded its steepest one-day drop in over 12 years. The same day proved prolific for spot Bitcoin ETFs, with over $477 million in inflows. Ethereum ETFs added $141 million, which is a clear indication that money is moving into riskier assets after a period of safe-haven demand.
The drop in Gold comes after an extended period of strong gains and a historic high at $4,380. The possibility of a higher Bitcoin price has increased due to funds rotating into riskier and potentially more speculative assets. However, the US Dollar Index has been moving north for a week now, which could hinder Bitcoin’s recovery. A stronger dollar makes it harder for Bitcoin to gain traction to the upside.
Geopolitical unrest is also a deterrent for crypto bulls. At the forefront are the new sanctions imposed by the U.S. against Russia and growing tariff tensions between the U.S. and China. However, earlier in the week, President Trump appeared optimistic about a solution to the crisis, saying that he expects to “make a deal on, I think, everything” with President Xi Jinping. A meeting between the two heads of state is scheduled next week in South Korea.
Chart Analysis – BTC/USD
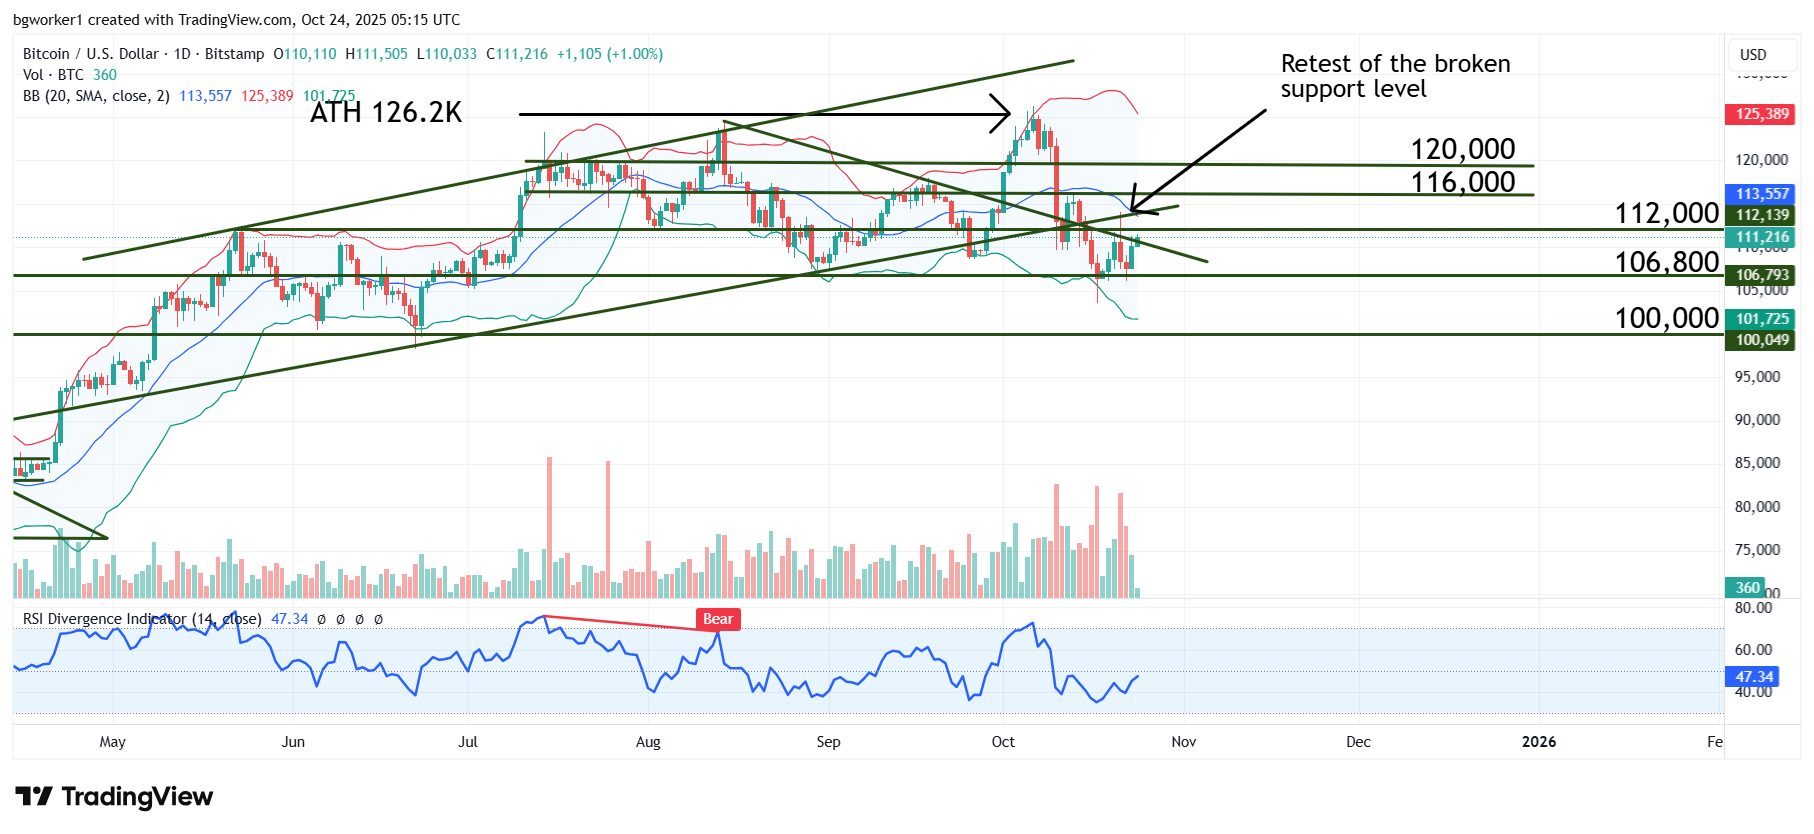
The ascending channel that confined Bitcoin is now broken, and we can no longer think this is a false break. After the initial move outside the channel, Bitcoin reached a low at $103,500, even breaking the low reached on the day of the “flash crash”, October 10.
The break of the channel was then reinforced by a test from below, when the bulls tried to take the price back above the lower boundary. This happened on Tuesday, October 21, the same day that Gold dropped from overbought levels. Despite an early climb, Bitcoin dropped by the end of the day, confirming that bullish pressure is quickly engulfed by the bears. This does not mean that a recovery is not possible, but for it to happen, we need to see a break of the bearish trend line drawn from the August 14 high. A better scenario would be a daily close above $112K, with supporting volume.
Bitcoin’s price action has been range-bound for the last few months (since mid-July), which is highlighted by the perfect bounces at the boundaries of the Bollinger Bands. Each time the price hits one band, it travels to the opposite band and then reverses.
If this behavior continues, then the next significant move will be bullish, aiming for the upper Bollinger Band. A breakdown would mean that the bears are in short-term control, making $100K a valid target.