Bitcoin Taps $110K Again. New All-Time High in Sight?
Rate Cut Hopes Evaporate. Could This Hinder Bitcoin’s Rally?
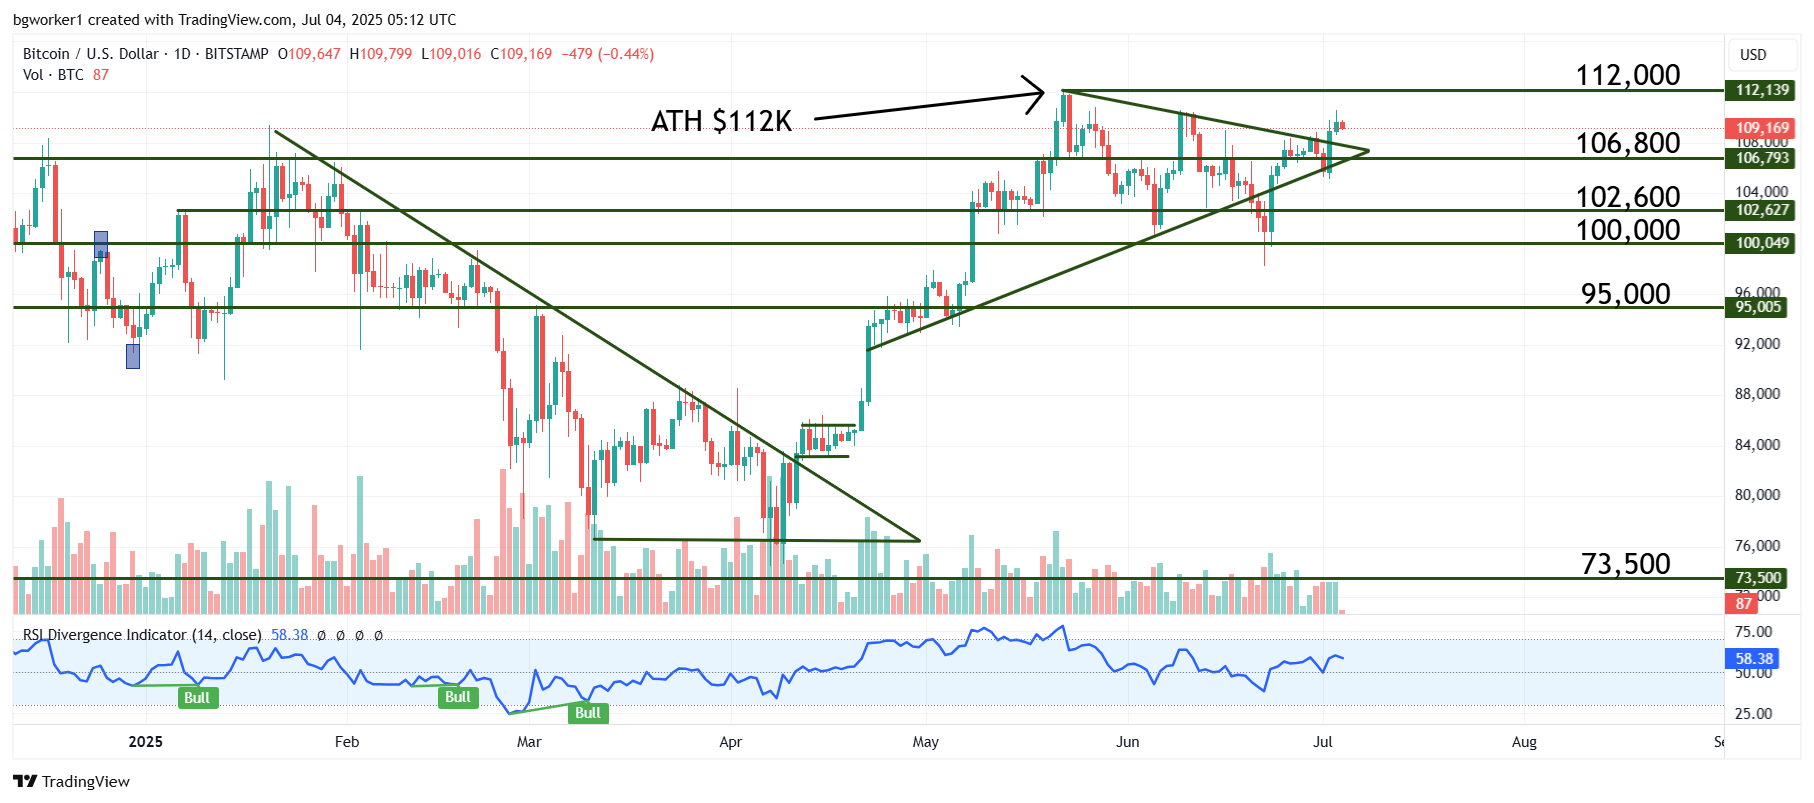
Bitcoin managed to break out of the symmetrical triangle that confined it since late May, showing renewed interest from almost all market participants. The main driver of the recent bullish cycle seems to be the strong performance of Bitcoin spot ETFs.
These investment vehicles registered 15 consecutive days of inflows. According to data from investment firm Farside, spot BTC Exchange Traded Funds have registered nearly $10 billion in inflows since May 1st, which is about 20% of the total inflow volume since their inception in January 2024.
Fed rate cut speculation may also be behind the recent BTC surge. More and more pundits see President Trump’s discontent towards Fed Chair Powell as a sign that a rate cut will come sooner rather than later. In April, the President said about Powell that the end of his term “can’t come fast enough” and was very vocal about the need to cut the rates. This implies that the next nominee to the Fed’s helm would be more inclined to adopt a looser monetary policy. More rate cuts would benefit Bitcoin, and this may be one of the reasons behind the recent massive ETF inflows and BTC price increase.
Adding to the recent volatility is the fact that supply on exchanges has been dropping for 98 days straight, making it the longest streak since 2020. This may create a supply shock where we may see Bitcoin push even higher due to the demand–supply principle (scarcity brings a higher price). It is also indicative that investors are withdrawing their coins to keep them in self-custody, which is another bullish sign.
A Resilient U.S. Jobs Market
The U.S. Non-Farm Employment report was released yesterday (a day earlier than usual, due to the 4th of July celebrations) and showed that 147K new jobs were created during the previous month, higher than the expected 111K. This initially strengthened the US Dollar because it fueled speculation of higher rates for longer. However, the BTC/USD drop was reversed during the same hour, and the pair resumed its climb.
Chart Analysis – BTC/USD
BTC/USD just broke out of the triangle mentioned earlier, moving above the bearish trend line drawn from the previous ATH reached in late May.
At the time of writing, Bitcoin is changing hands at $109,150 after reaching as high as $110,500. The All-Time High at $112,000 is very close but it looks like the bulls are taking a breather, at least for now.
The RSI is not signalling any extreme condition and is moving upward. Theoretically, this opens the door for a test of the ATH, but keep in mind that the macroeconomic scene is still shaky and could spark surprise drops in price.