History in the Making: Bitcoin’s Journey to $100K
The Weekly RSI Marches Forward Into Overbought Territory as Bitcoin Retreats off Highs.
Donald Trump’s victory in the Presidential race ignited the fire that propelled Bitcoin to unseen-before heights but the signs were already there. For a long time, Bitcoin was trapped inside a descending channel and usually, when an asset breaks out of a confining pattern, the movement that follows is wild.
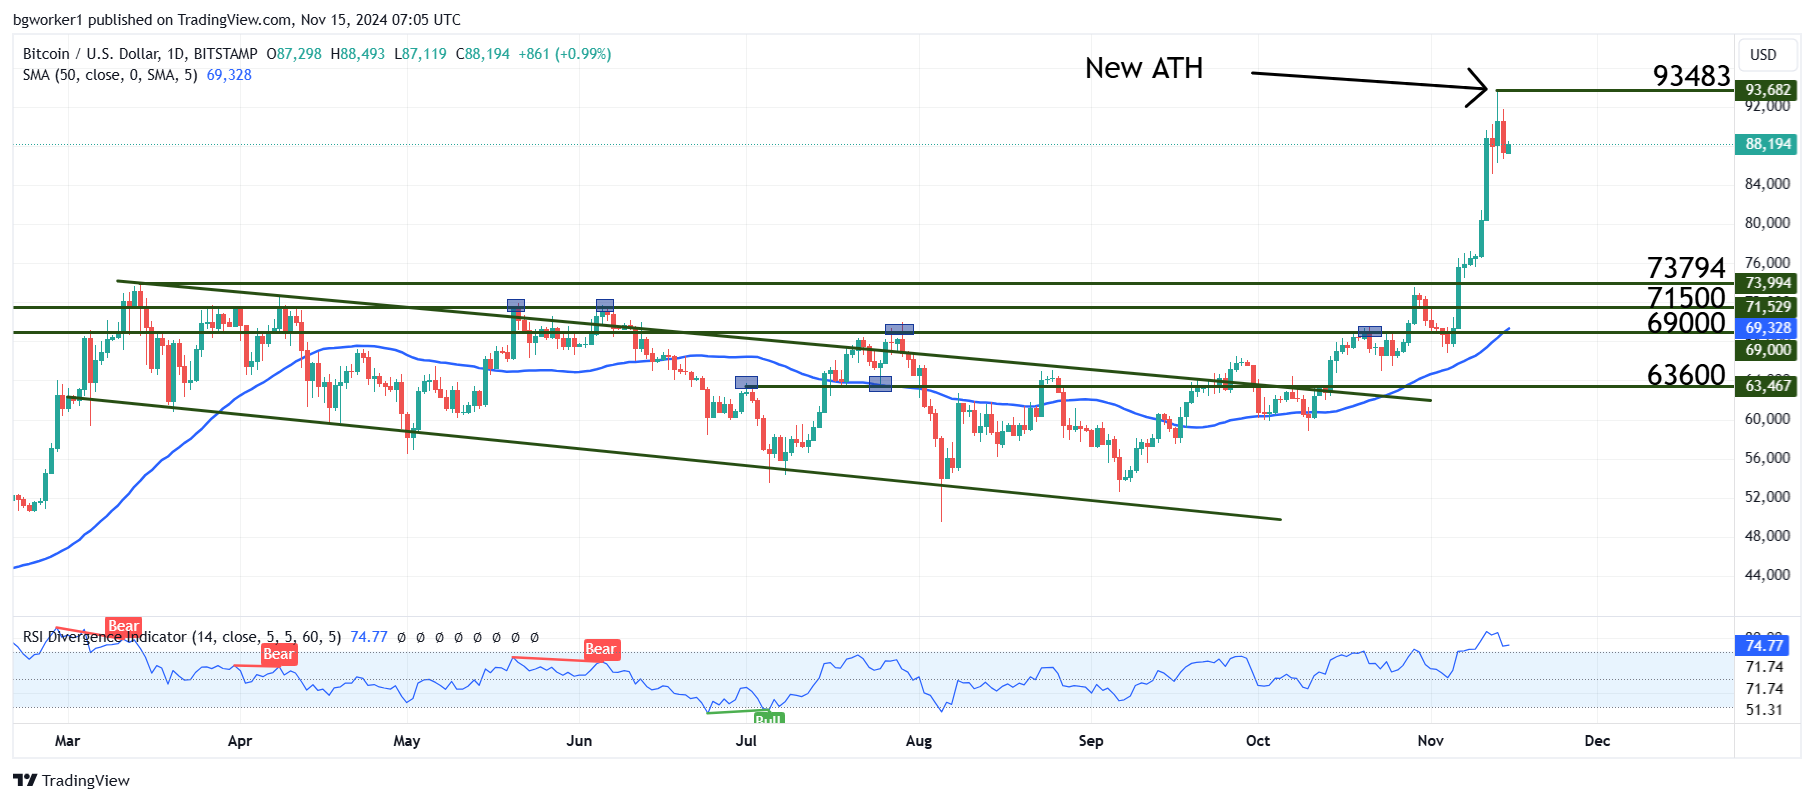
Bitcoin was trapped inside the channel for 7 months, ever since the previous All-Time High (ATH) at $73,794. When it finally broke out, the stage was set for a strong rally, and Trump’s win was the perfect combination of technicals and fundamentals coming together.
After reaching a whopping price of $93,483, Bitcoin is starting to cool off and has retreated below $90K, currently trading at $88,300. Although it looks small compared to the overall trend, this pullback liquidated $447 million worth of leveraged long positions in just 24 hours.
A big role in the current retracement is played by profit-taking, which is normal after a huge rally. The level at $90,000 is a massive psychological barrier, which combined with an oversold RSI, looks like a good place to cash out on some long positions. Of course, the next landmark is $100,000, which has been often the subject of jokes and memes. Not so much now, when Bitcoin is so close to this legendary number.
Chart Analysis – BTC/USD
After coming just a few hundred dollars short of $90K on November 11, Bitcoin printed an indecision candle with long wicks and a small body. Many times, a strong uptrend does not simply end, but instead, it pushes one more time and then it dims down for a more substantial pullback.
This second push came on Wednesday, November 13 when Bitcoin hit its current ATH at $93,483. But make no mistake, the clue was there since a day prior (the red indecision candle). What can we expect next is a deeper pullback but the market is in pure speculative mode, with investors waiting to pull the trigger on more orders.
We will likely experience a period of increased volatility, where a big role will be played by the U.S. monetary policy. The Relative Strength Index (RSI) is overbought on a Daily chart but it is also entering overbought on the Weekly chart. To put things in perspective, BTC was also overbought in December 2023 but it climbed from around $35K to above $73K without any notable pullback. This was all done with an overbought RSI on the Weekly chart.
So, while technically the RSI on the Daily and Weekly charts warns about a pullback, we should never underestimate the market’s resilience and fear of missing out.