3/4 ITM Binary Options Trades
This article was originally contributed by the archived community member Kostasze. We no longer maintain contact details for the original author. The content has been fact-checked and updated for accuracy by our editorial team.
Hey Traders,
Today I am going to show you and discuss with you my trades and my setups, I took four 60 seconds binary options trades . I had a 3/4 performance. Let’s see my trades.
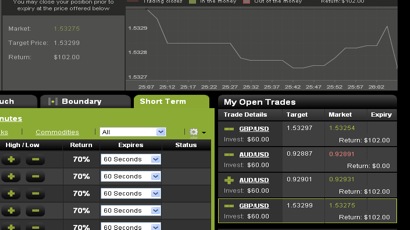
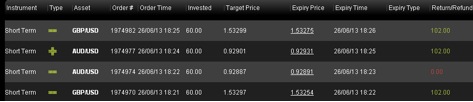
As you can see I took four 60 seconds forex binary options trades as I said. Two trades in AUD/USD currency pair and two trades in AUD/USD currency pair. My second trade in AUD/USD was the one out the money. Now I am going to show you and explain you my setups as usually. Let’ go.
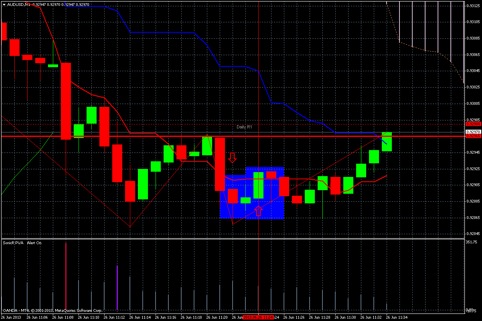
This is the first chart where you can see my today trades in AUD/USD currency pair. I took one put and one call. Let’s analyze the general picture. The price is moving to the daily R1 and we have a small reversal as you can see in the beginning of the chart, the two small green candles. After that the price breaks this support and moving down and three minutes later we have a new support. Then the price is moving back to the broken support which acts as a resistance now. After the reversal in the resistance I took one put in the put arrow. You can see that actually it must be ITM instead of OTM but I missed the entry this time, I took my trade late and the expiry was in the next green candle. This is a con for 60 seconds trades.You can easily lose a good entry.Finally the price makes a reversal in the previous support and I took my second trade in AUD/USD currency pair, I took a call in the call arrow which was a solid ITM.
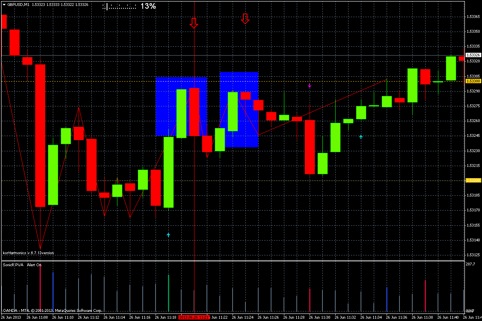
This is the second chart of the day it’s from GBP/USD currency pair. I took two puts in the put arrows The price makes a good resistance in the first blue rectangle. It’s a little bit below a whole number and this is one reason I take a put here. The other reason is the buying climax in the previous candle and as you can see in the volume the price is increasing with decreasing volume below a whole number, serious reason for a put. My next trade was four minutes later, I took another put when the price hit again the same resistance level. Both of the were in the money trades. The general picture of the market was a strong down trend but notice the two volume bars in the beginning of the screen shot, we have a signs of the end of this down trend.
Best Regards,
Kostasze